STRICTLY AVERAGE

We are concerned citizen-researchers who’ve tried to answer a compelling question that perhaps preoccupies many of us as we search for the “meaning” of our vote as we seek to make it relevant.


So let the guessing cease, let the truth unleash.
Quench your thirst, let the myth bubble burst.
Before you complain, cast your 'informed vote' first.

Strictly Average

Starting in mid-2023, we started studying the performance of the ruling party (BJP) using verified data from the Government’s own official websites and analysis sourced from independent civil society organizations that have been guardians of Indian democracy for many years (myneta.info, Informed Voter Project, PRSIndia.org and others). And very rapidly, a stark pattern emerged; that of the BJP and the NDA Alliance being a ‘strictly average’ party - in sharp contrast with the image of world-leaders that is projected on our screens. Perhaps surprising to many of us - but we’ve checked these numbers many times over, and you can check them too at https://sansad.in/ls and at https://mplads.gov.in

As a wise-person once said: “Ideology is all well and good, but once in a while we must pay attention to the facts.”

To discover yourself, scroll down ↓


17th Lok Sabha

(2019 - 2024)


Average Age of a Politician

Share this on: X (previously Twitter)   |   LinkedIn   |   Facebook   |   Instagram   |   Download ⤓

Front Image 1 Back Image 1
Front Image 2 Back Image 2
Front Image 3 Back Image 3
Front Image 4 Back Image 4
Front Image 5 Back Image 5


Average Number of Debates participated in

Share this on: X (previously Twitter)   |   LinkedIn   |   Facebook   |   Instagram   |   Download ⤓

Front Image 1 Back Image 1
Front Image 2 Back Image 2
Front Image 3 Back Image 3
Front Image 4 Back Image 4
Front Image 5 Back Image 5


% of Expenditure vs. Entitlement

Share this on: X (previously Twitter)   |   LinkedIn   |   Facebook   |   Instagram   |   Download ⤓

Front Image 1 Back Image 1
Front Image 2 Back Image 2
Front Image 3 Back Image 3
Front Image 4 Back Image 4
Front Image 5 Back Image 5


Average Number of Private Member Bills introduced

Share this on: X (previously Twitter)   |   LinkedIn   |   Facebook   |   Instagram   |   Download ⤓

Front Image 1 Back Image 1
Front Image 2 Back Image 2
Front Image 3 Back Image 3
Front Image 4 Back Image 4
Front Image 5 Back Image 5


Average Number of Questions asked in the house

Share this on: X (previously Twitter)   |   LinkedIn   |   Facebook   |   Instagram   |   Download ⤓

Front Image 1 Back Image 1
Front Image 2 Back Image 2
Front Image 3 Back Image 3
Front Image 4 Back Image 4
Front Image 5 Back Image 5


Average Attendance in the house

Share this on: X (previously Twitter)   |   LinkedIn   |   Facebook   |   Instagram   |   Download ⤓

Front Image 1 Back Image 1
Front Image 2 Back Image 2
Front Image 3 Back Image 3
Front Image 4 Back Image 4
Front Image 5 Back Image 5


Average Female to Male Ratio

Share this on: X (previously Twitter)   |   LinkedIn   |   Facebook   |   Instagram   |   Download ⤓

Front Image 1 Back Image 1
Front Image 2 Back Image 2
Front Image 3 Back Image 3
Front Image 4 Back Image 4
Front Image 5 Back Image 5


MINORITY STATUS RATIO

Share this on: X (previously Twitter)   |   LinkedIn   |   Facebook   |   Instagram   |   Download ⤓

Front Image 1 Back Image 1
Front Image 2 Back Image 2
Front Image 3 Back Image 3
Front Image 4 Back Image 4
Front Image 5 Back Image 5


AVERAGE YEARS OF SCHOOLING

Share this on: X (previously Twitter)   |   LinkedIn   |   Facebook   |   Instagram   |   Download ⤓

Front Image 1 Back Image 1
Front Image 2 Back Image 2
Front Image 3 Back Image 3
Front Image 4 Back Image 4
Front Image 5 Back Image 5


Members with Serious Criminal Red Flags

Share this on: X (previously Twitter)   |   LinkedIn   |   Facebook   |   Instagram   |   Download ⤓

Front Image 1 Back Image 1
Front Image 2 Back Image 2
Front Image 3 Back Image 3
Front Image 4 Back Image 4
Front Image 5 Back Image 5
Disclaimer

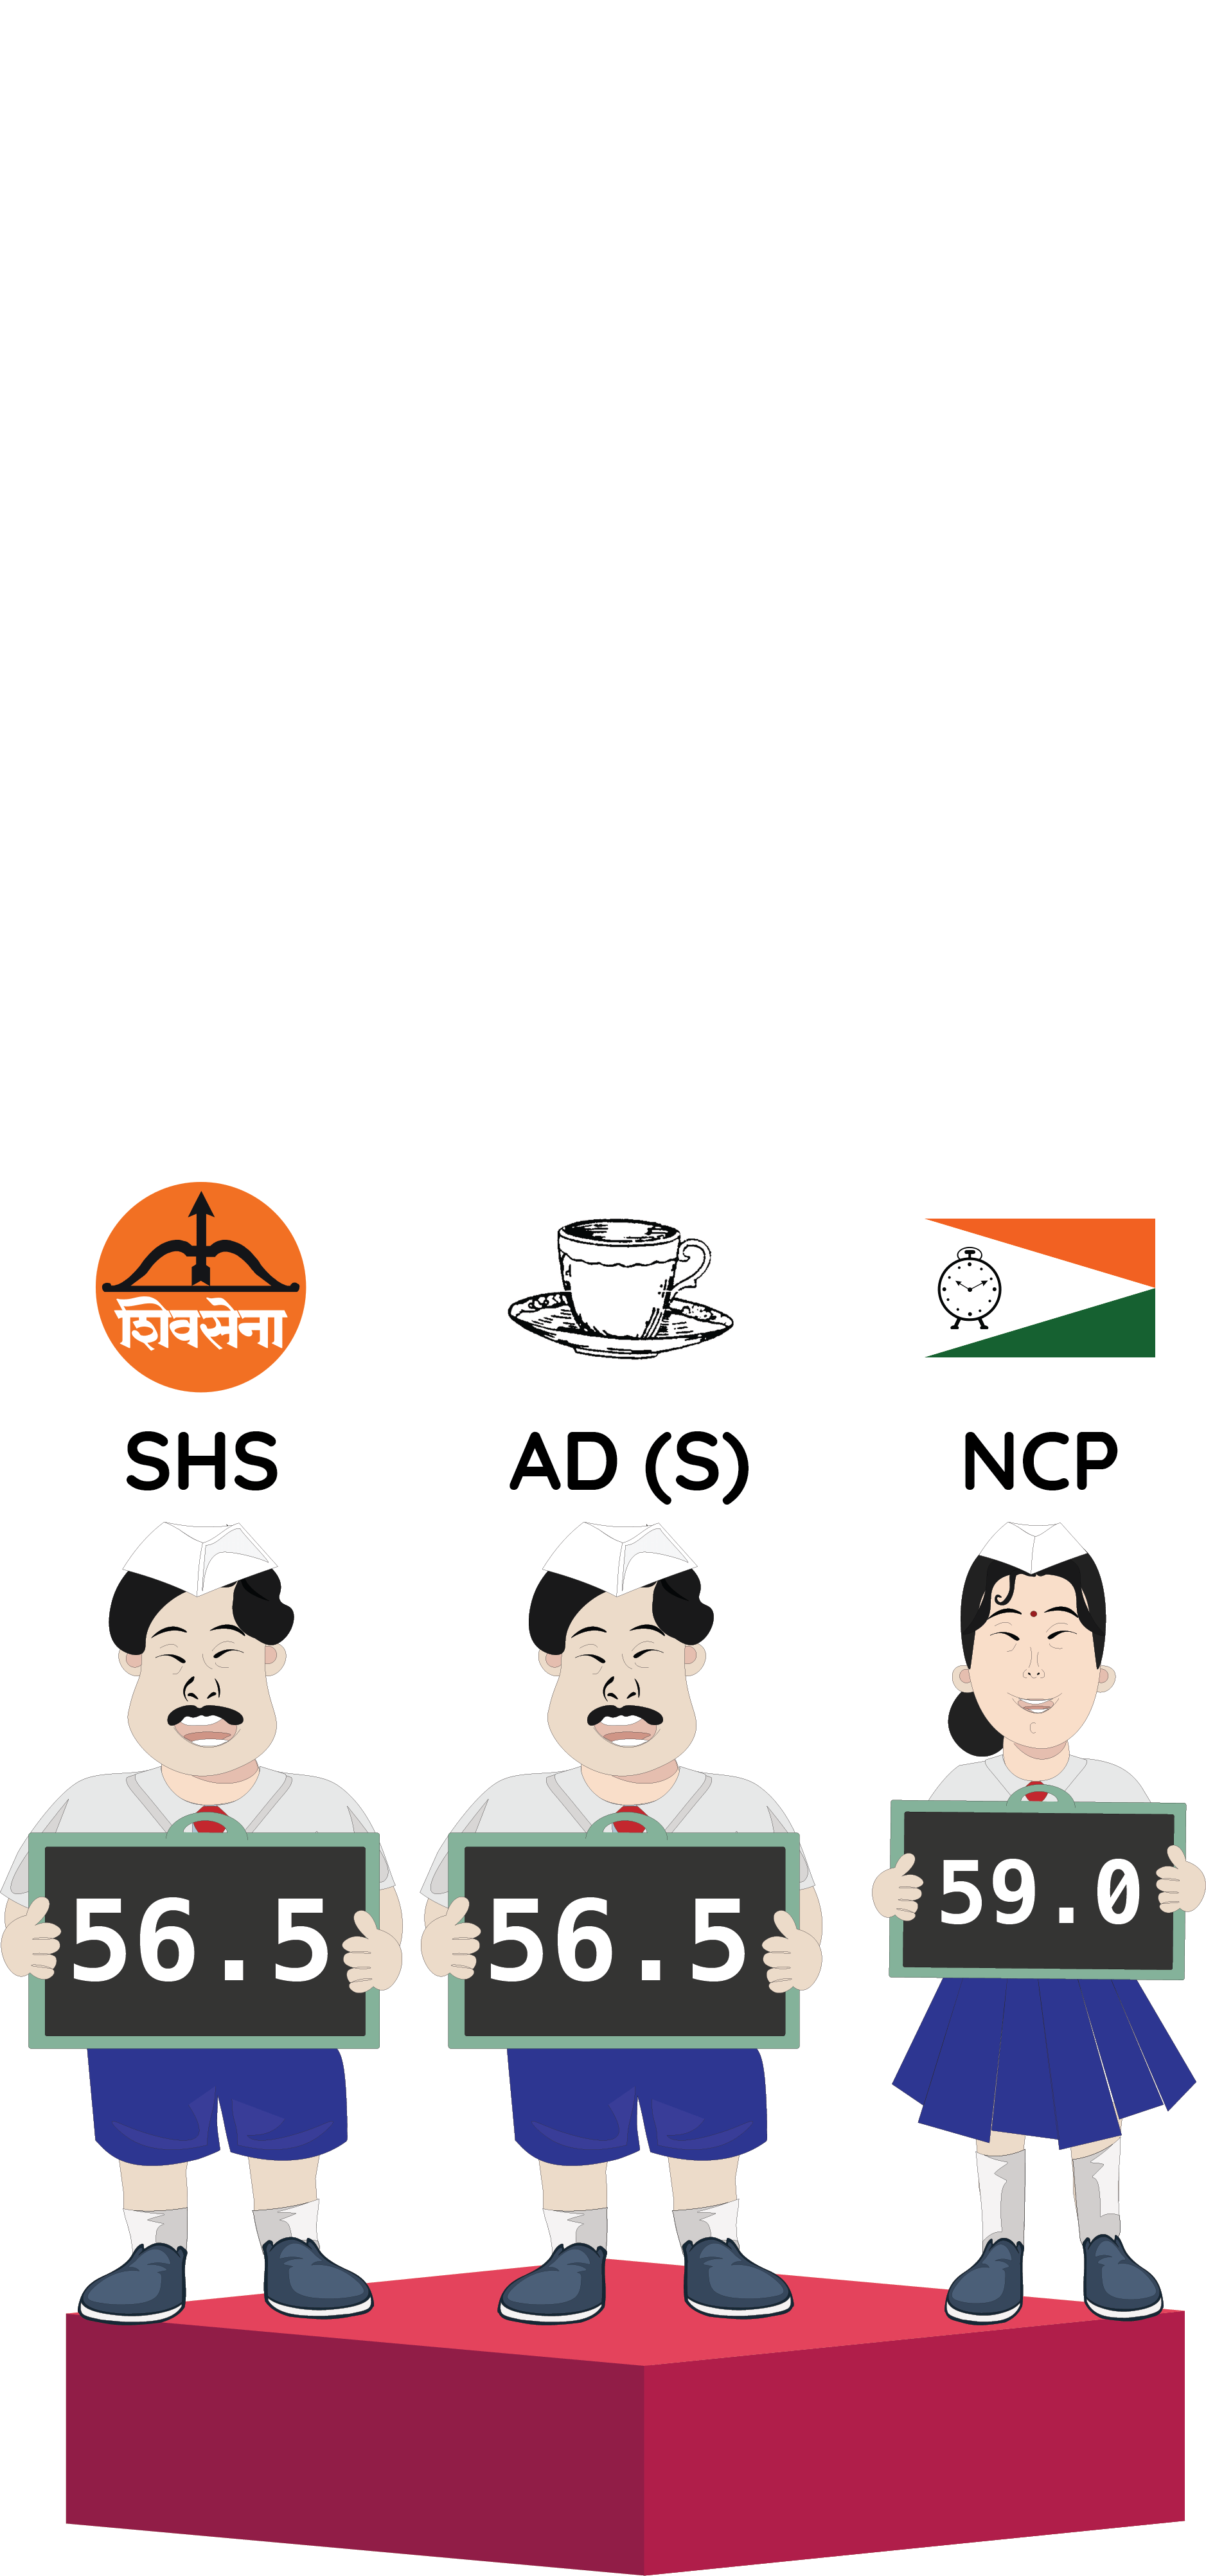
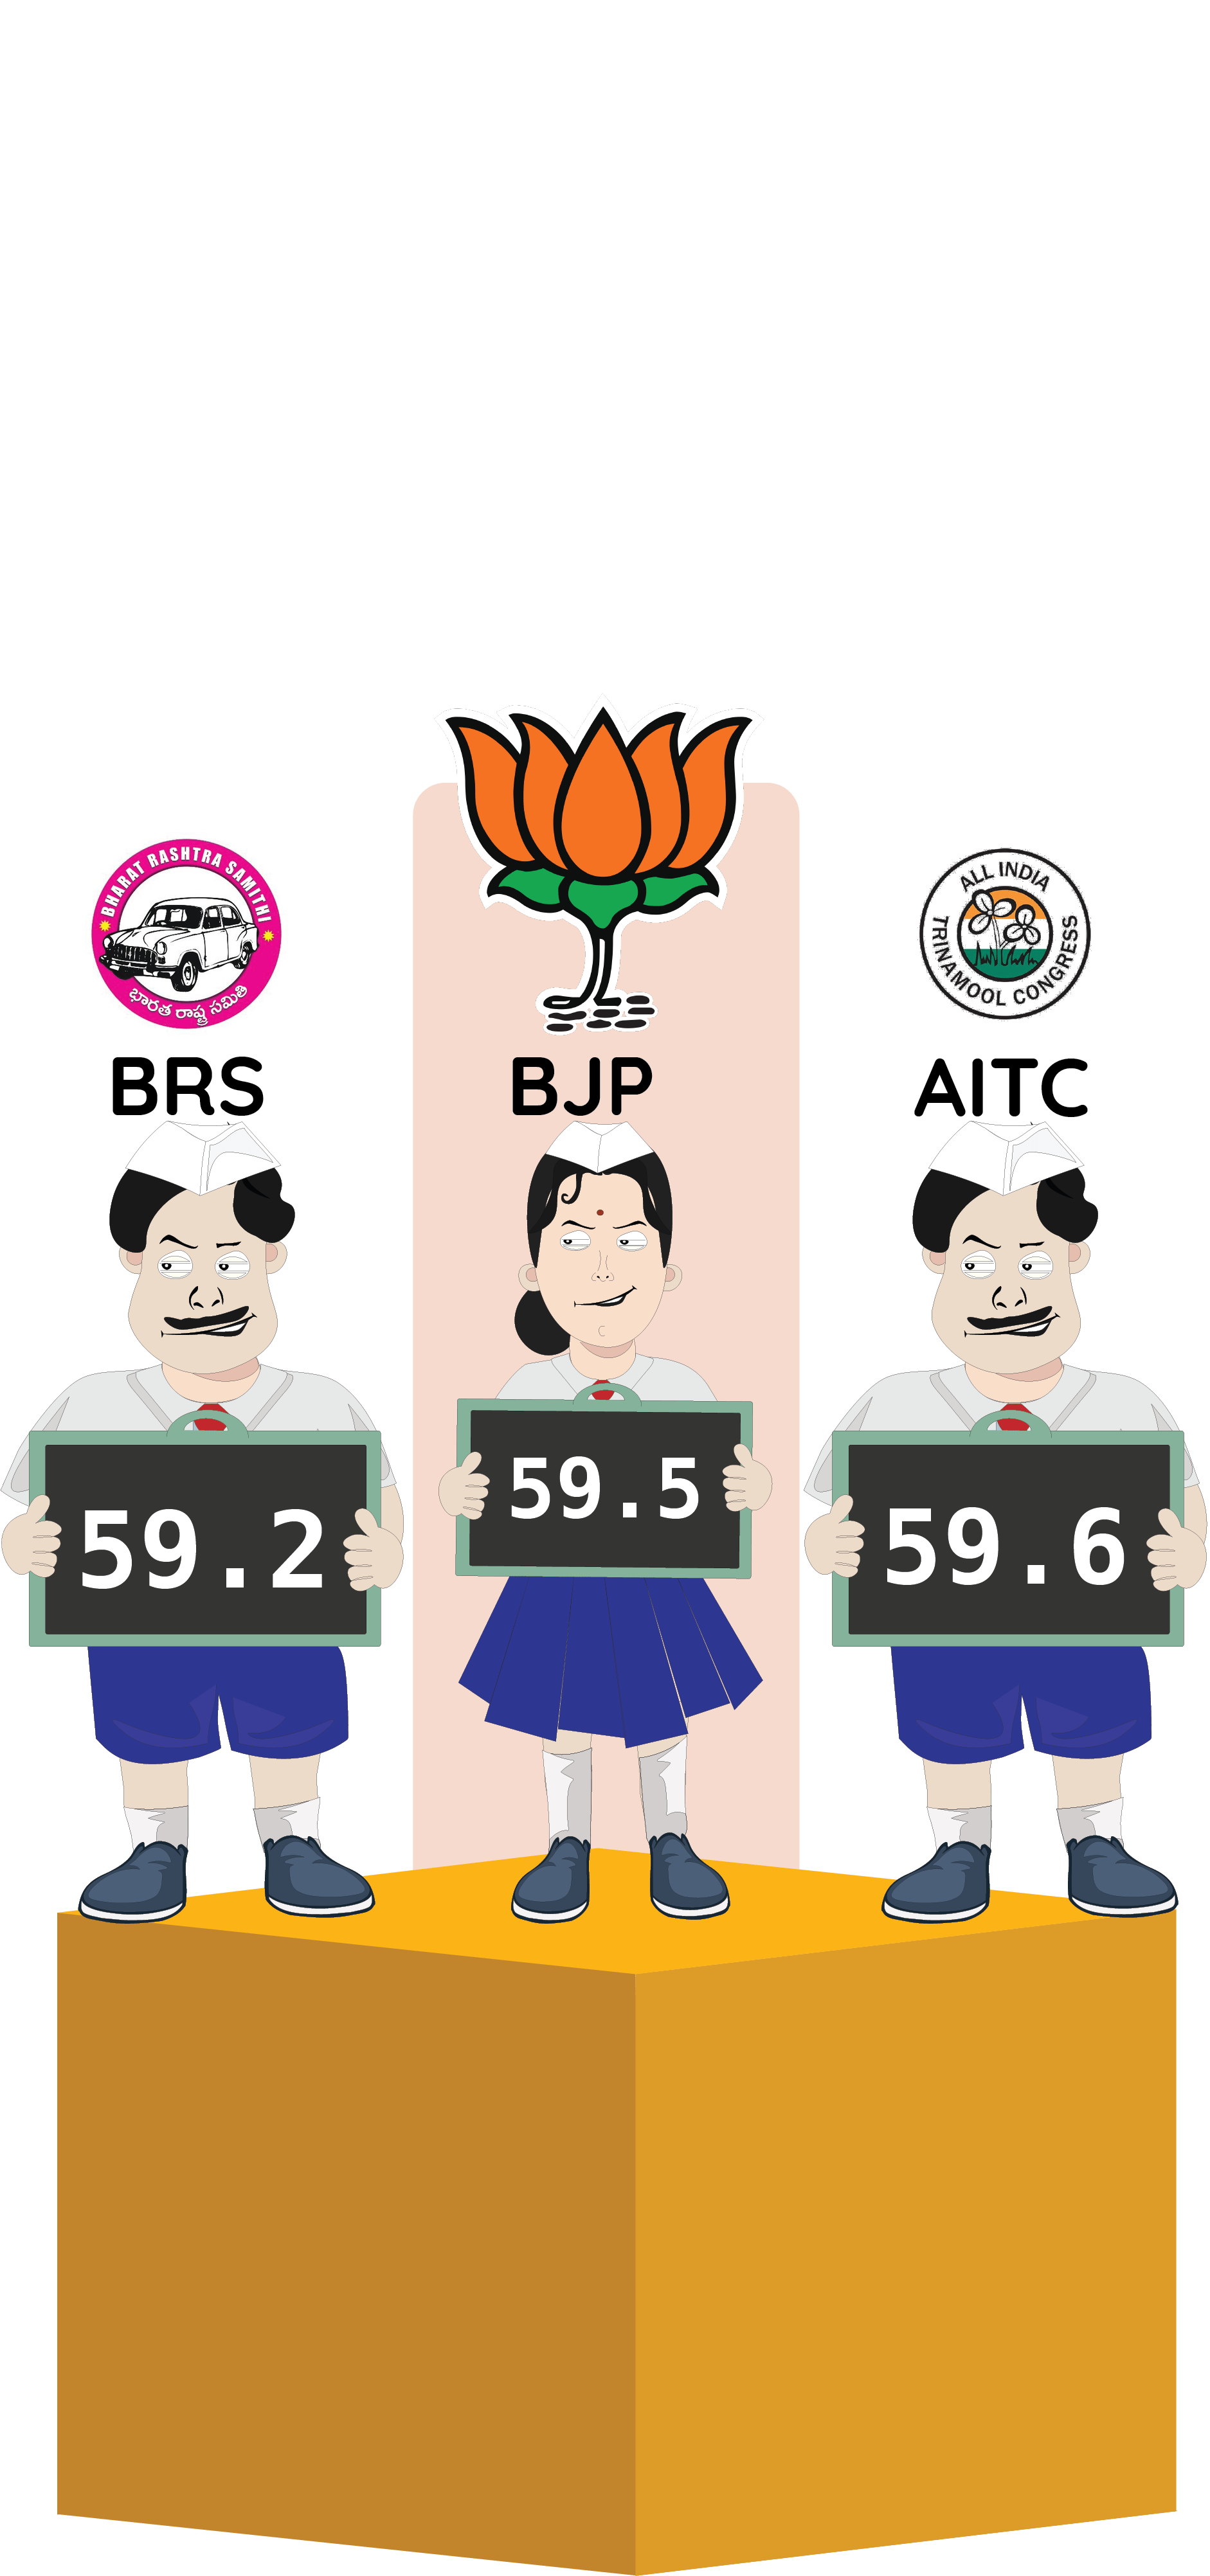
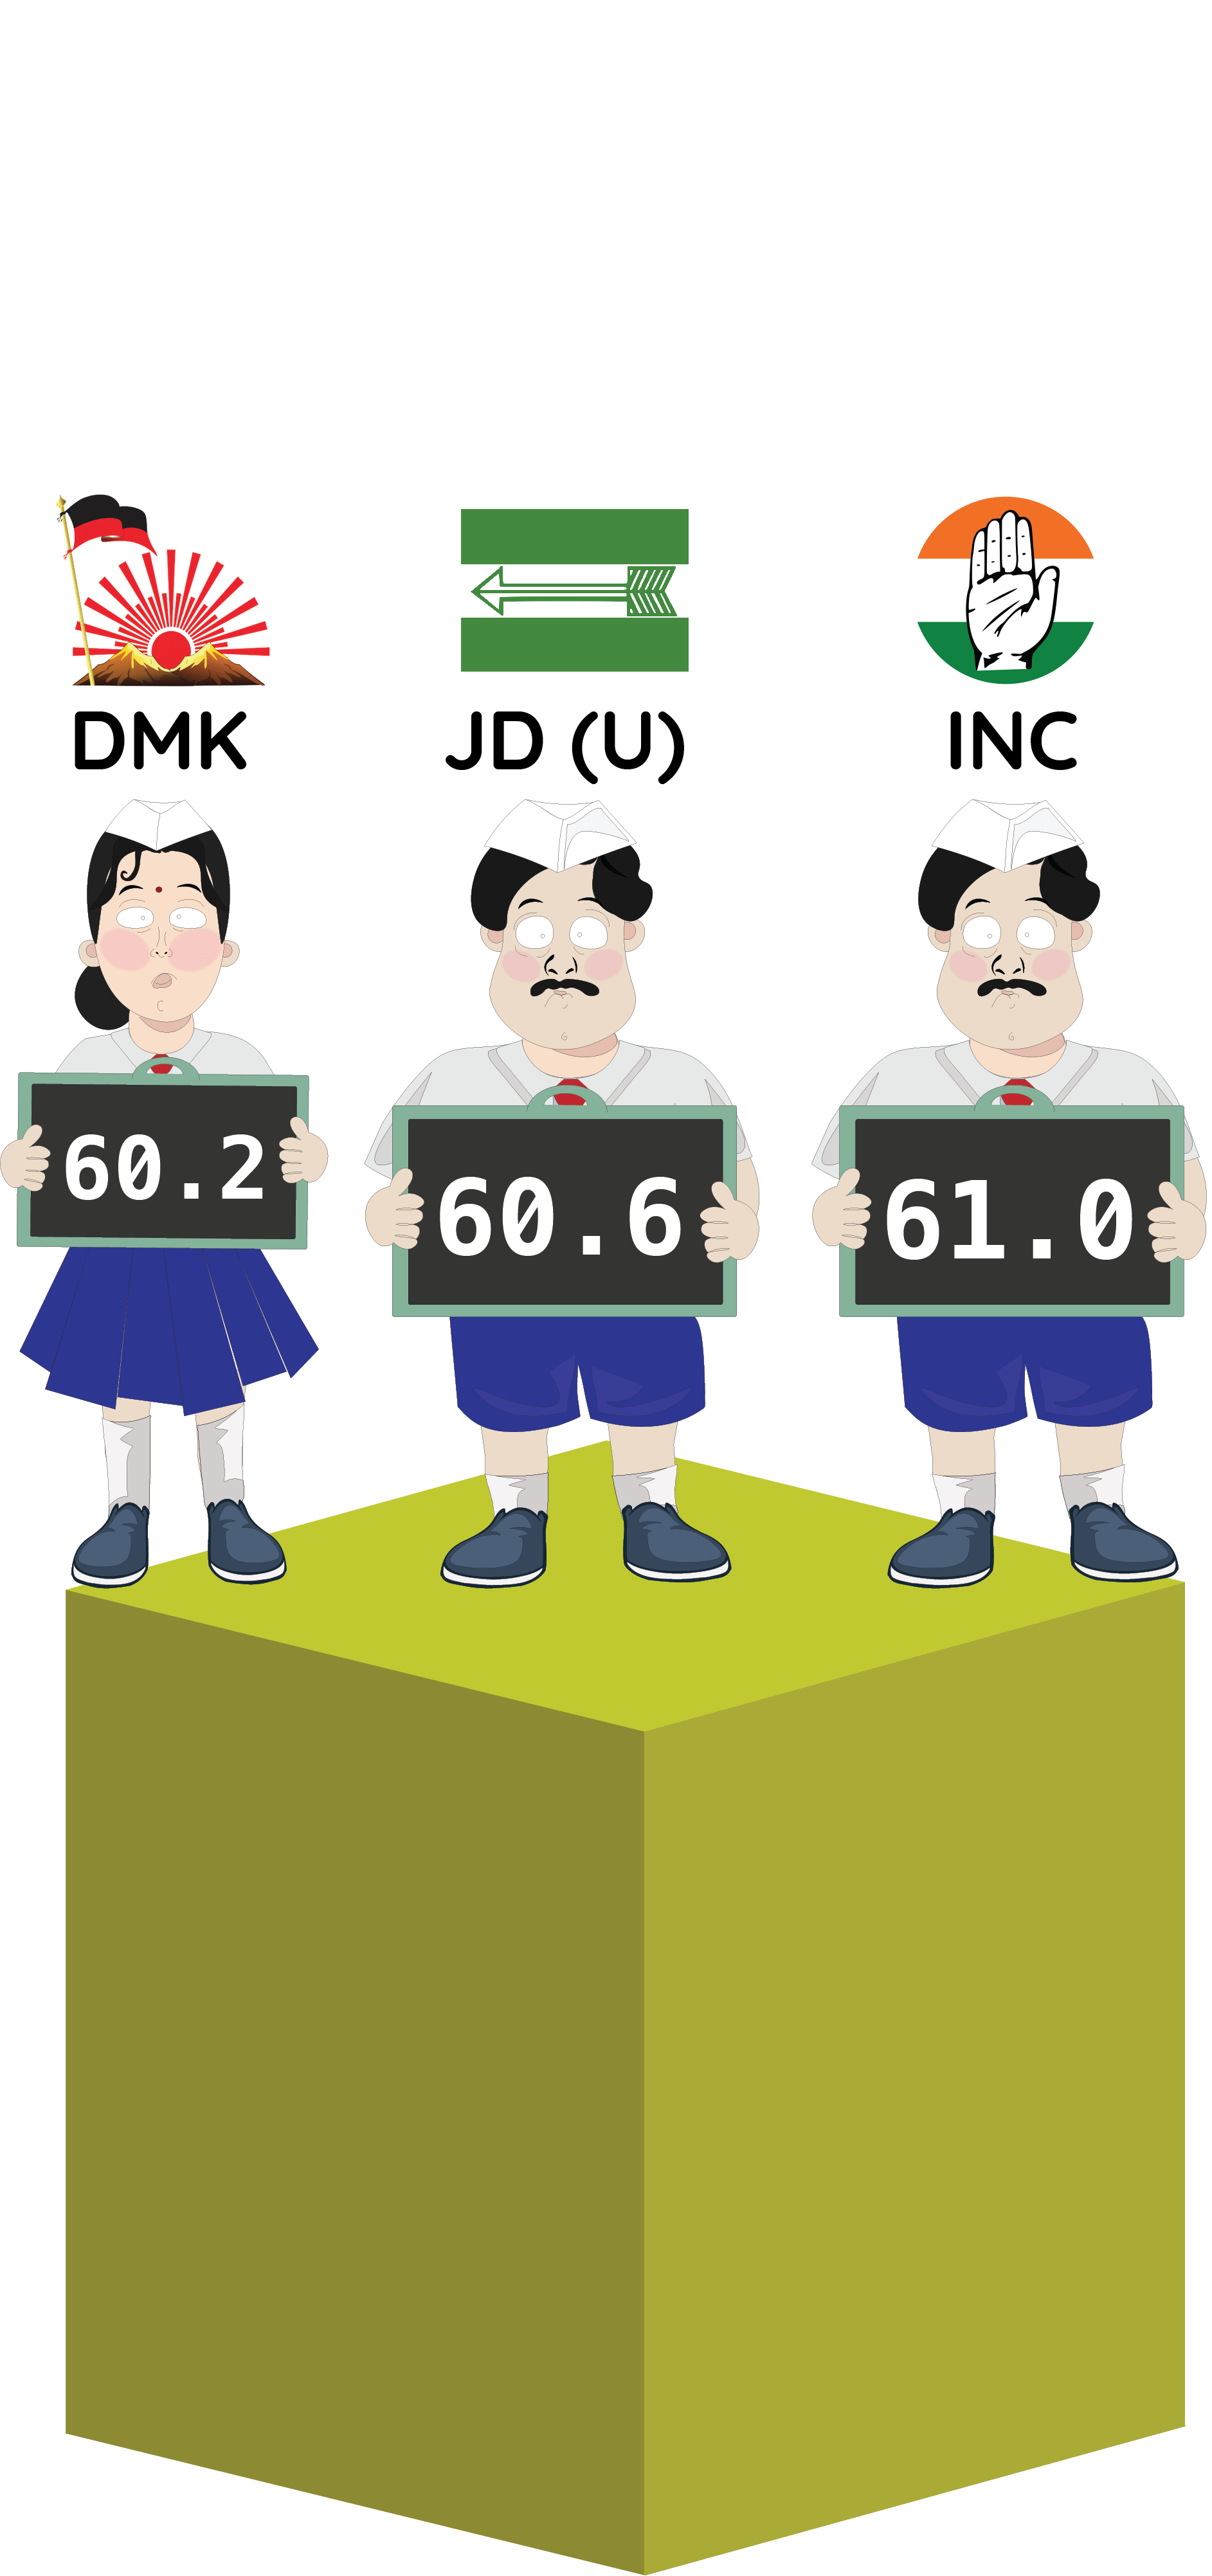
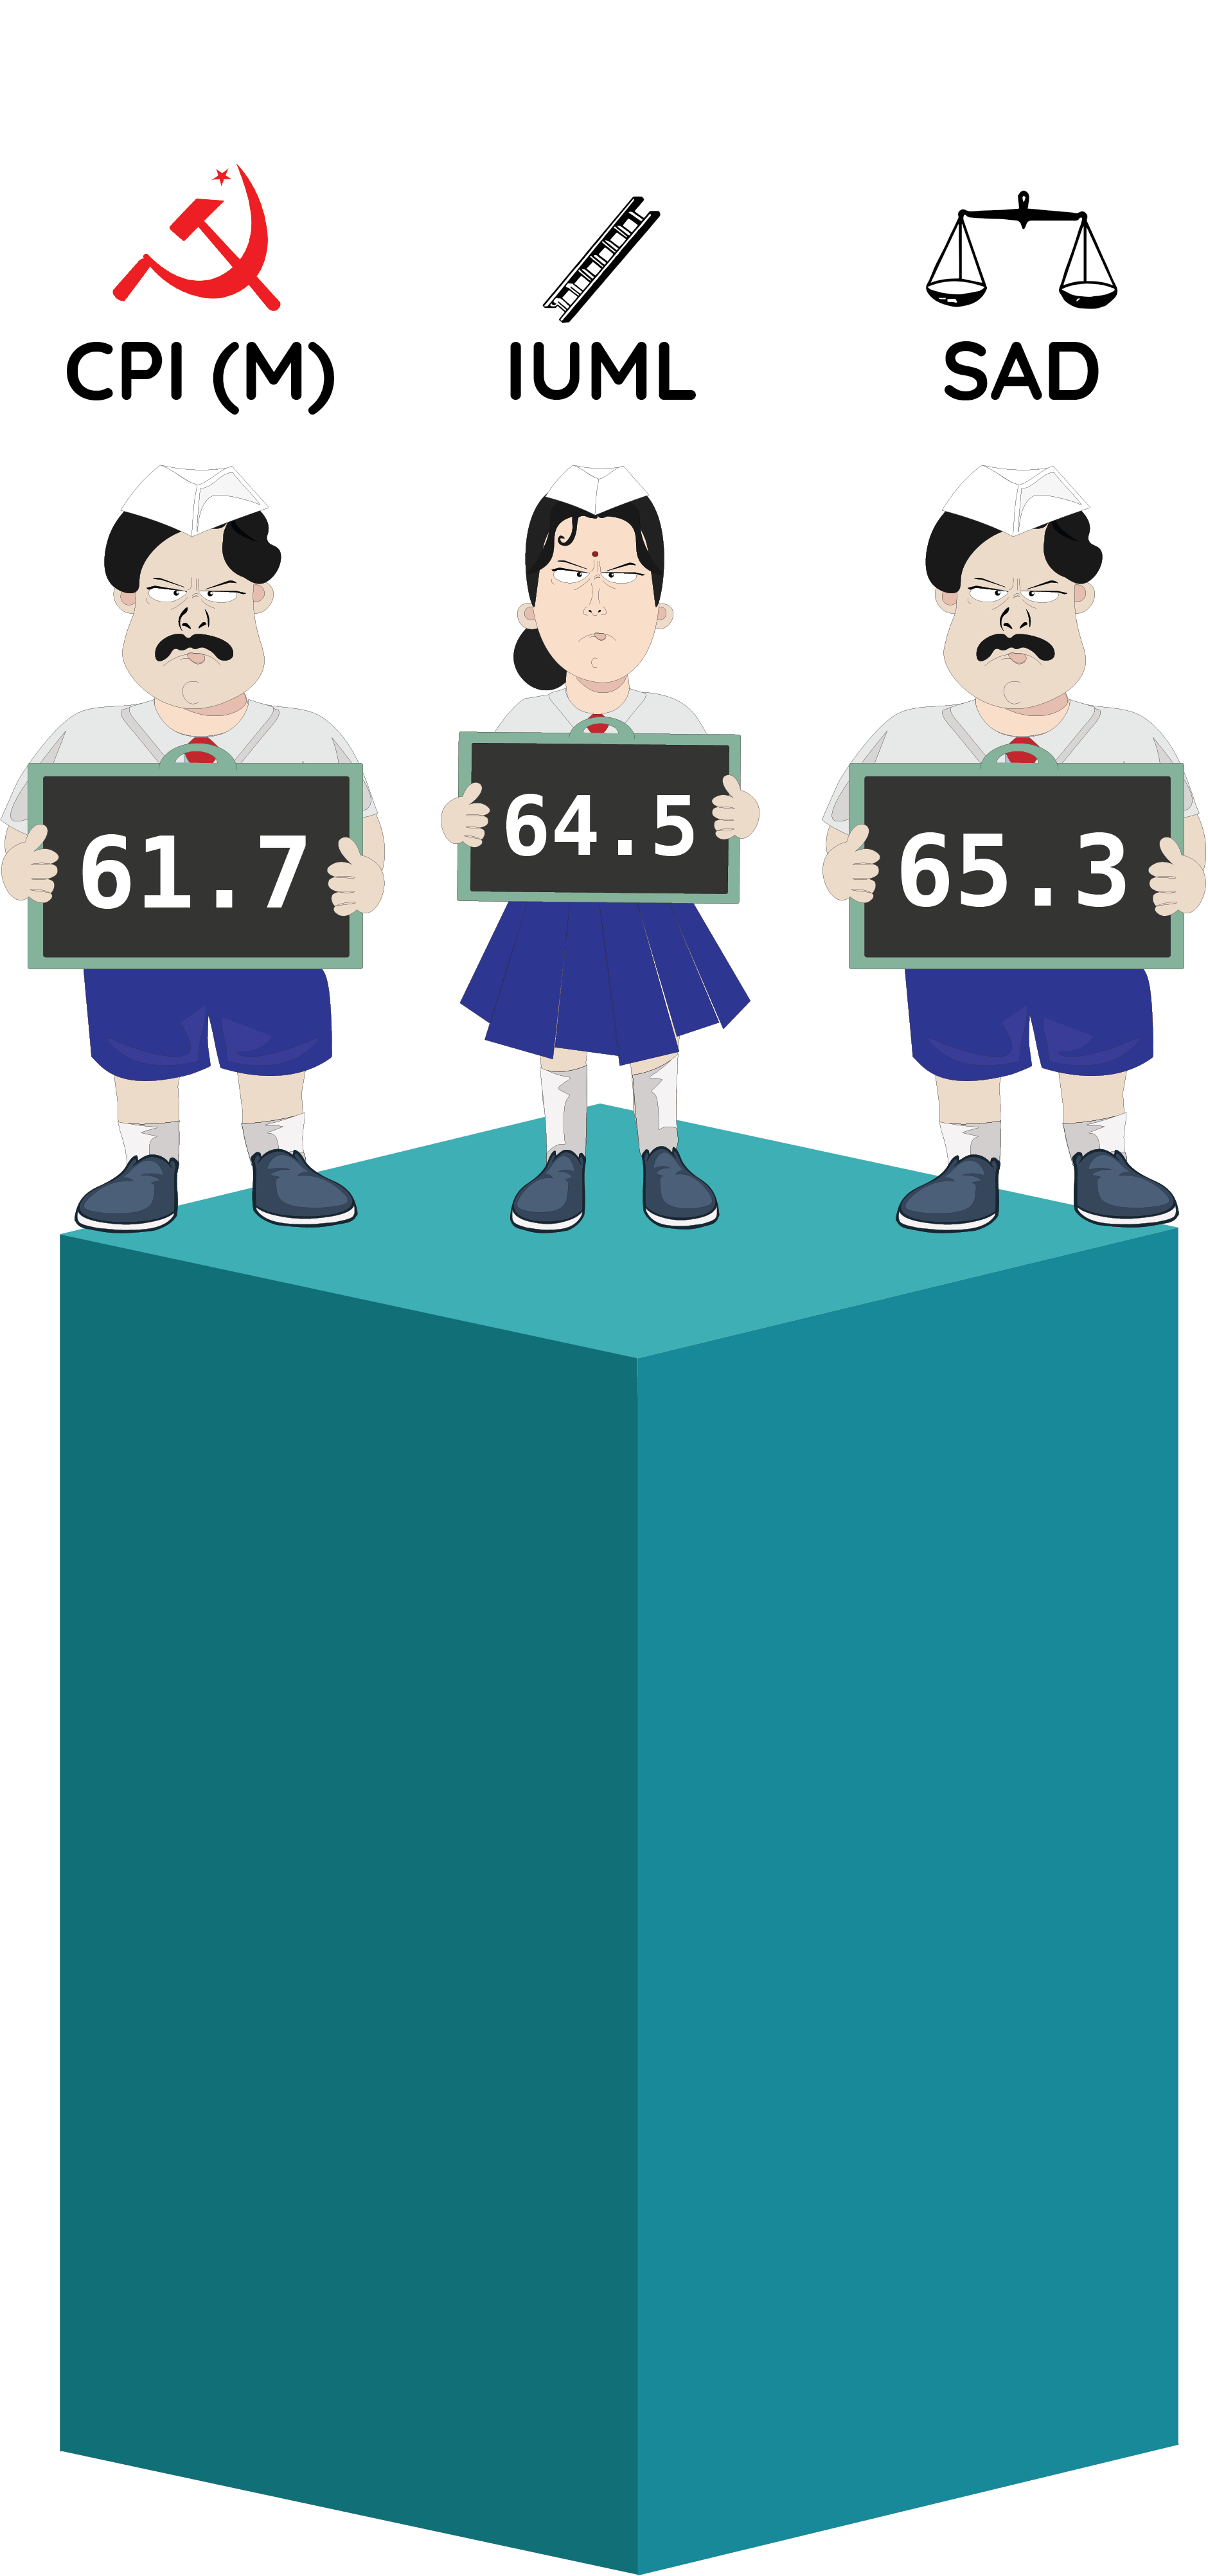
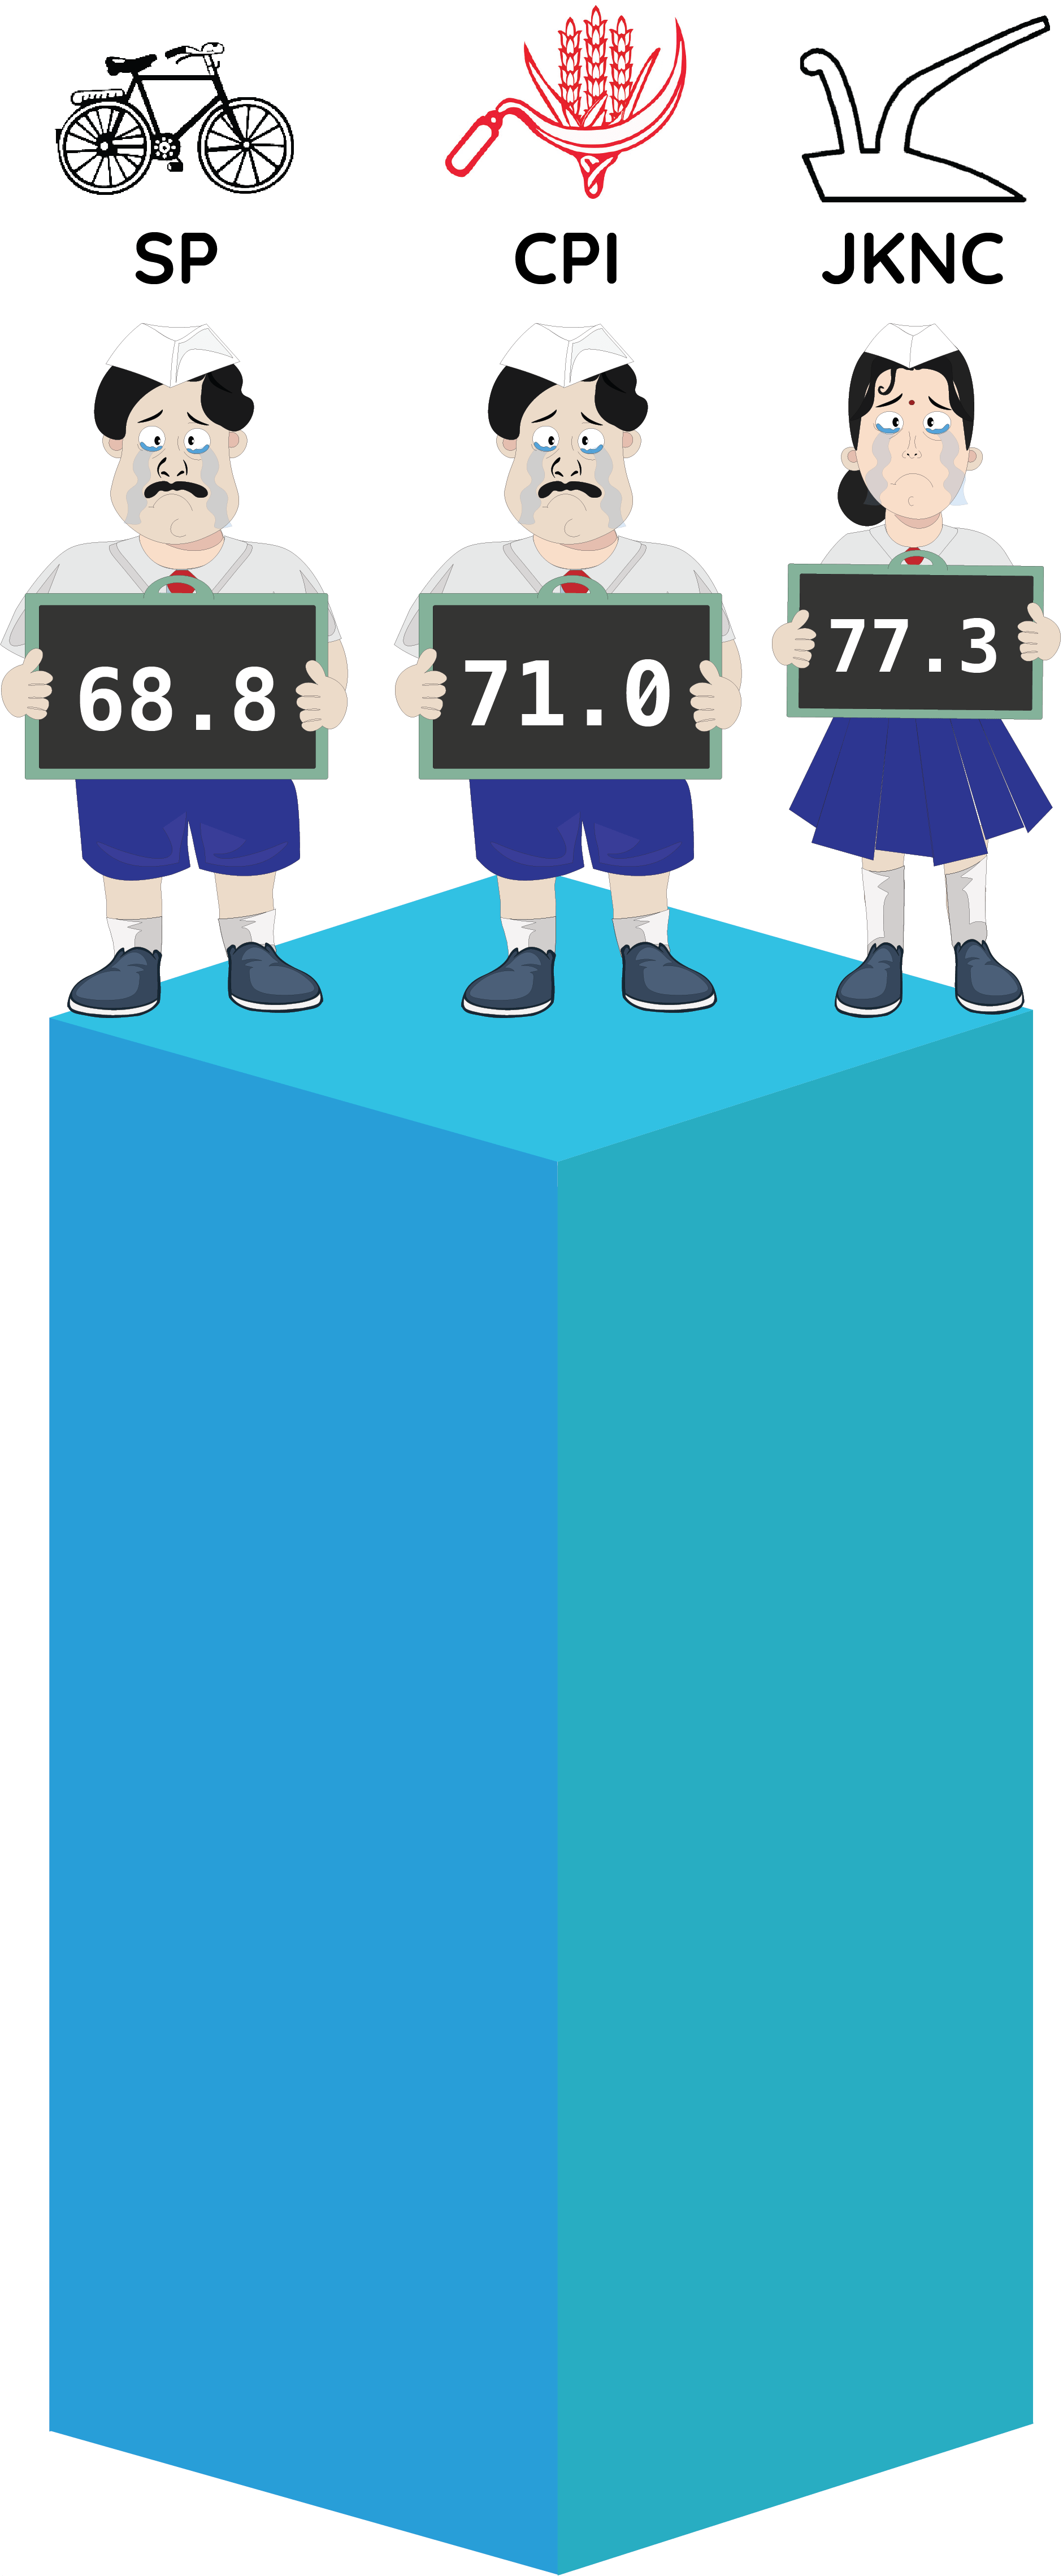
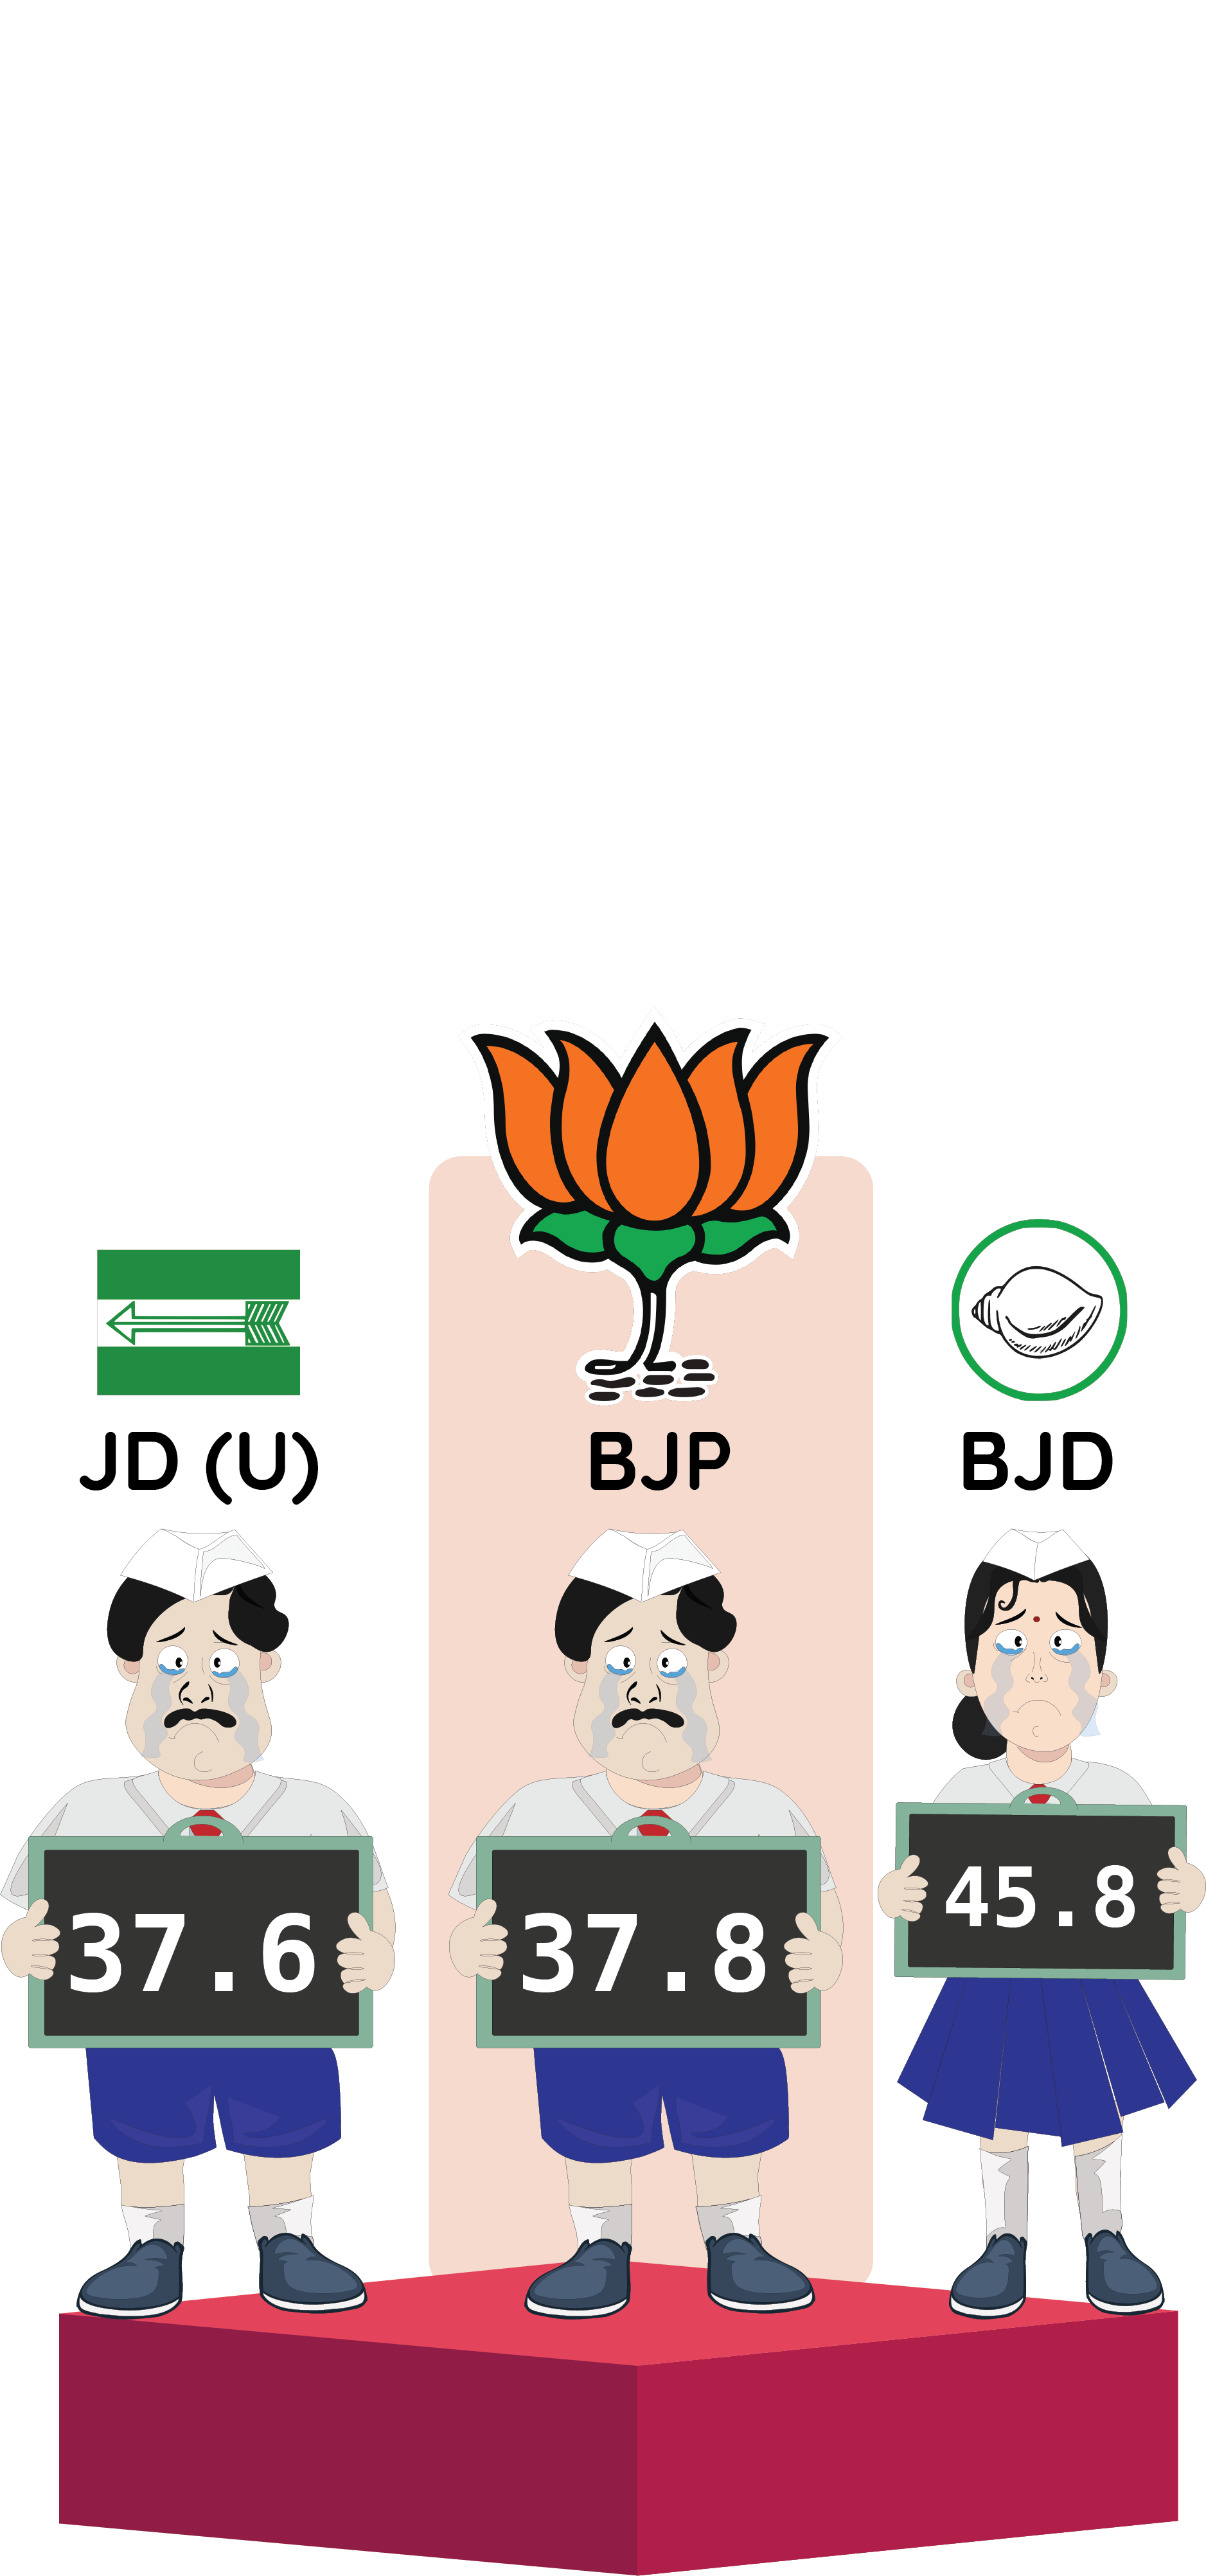
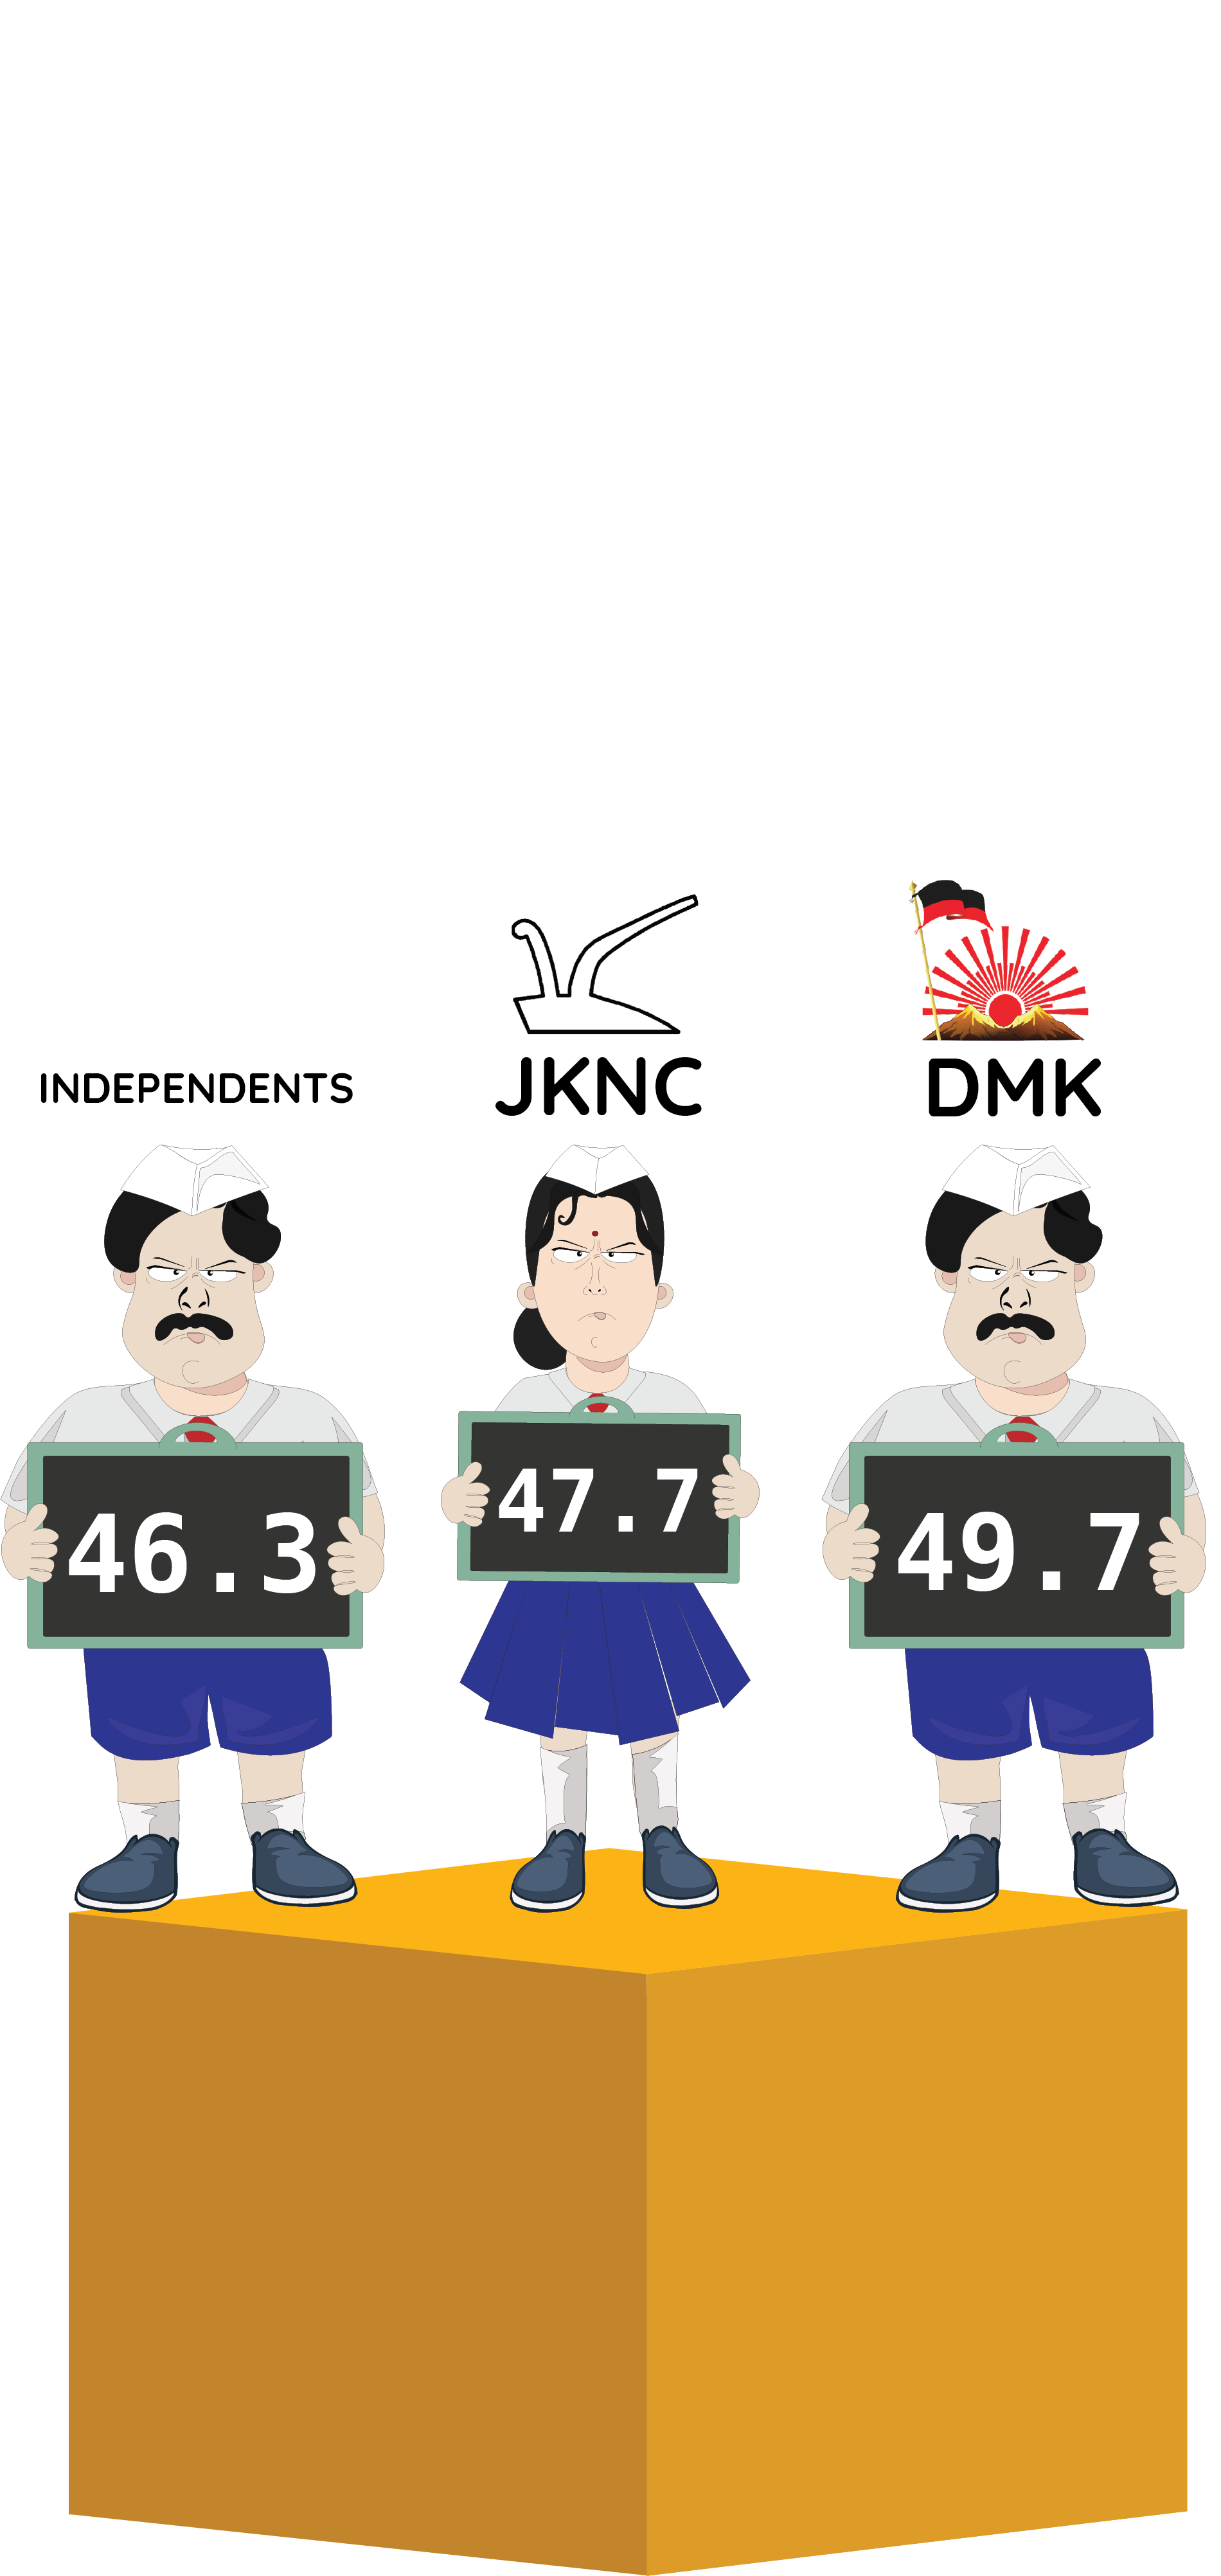
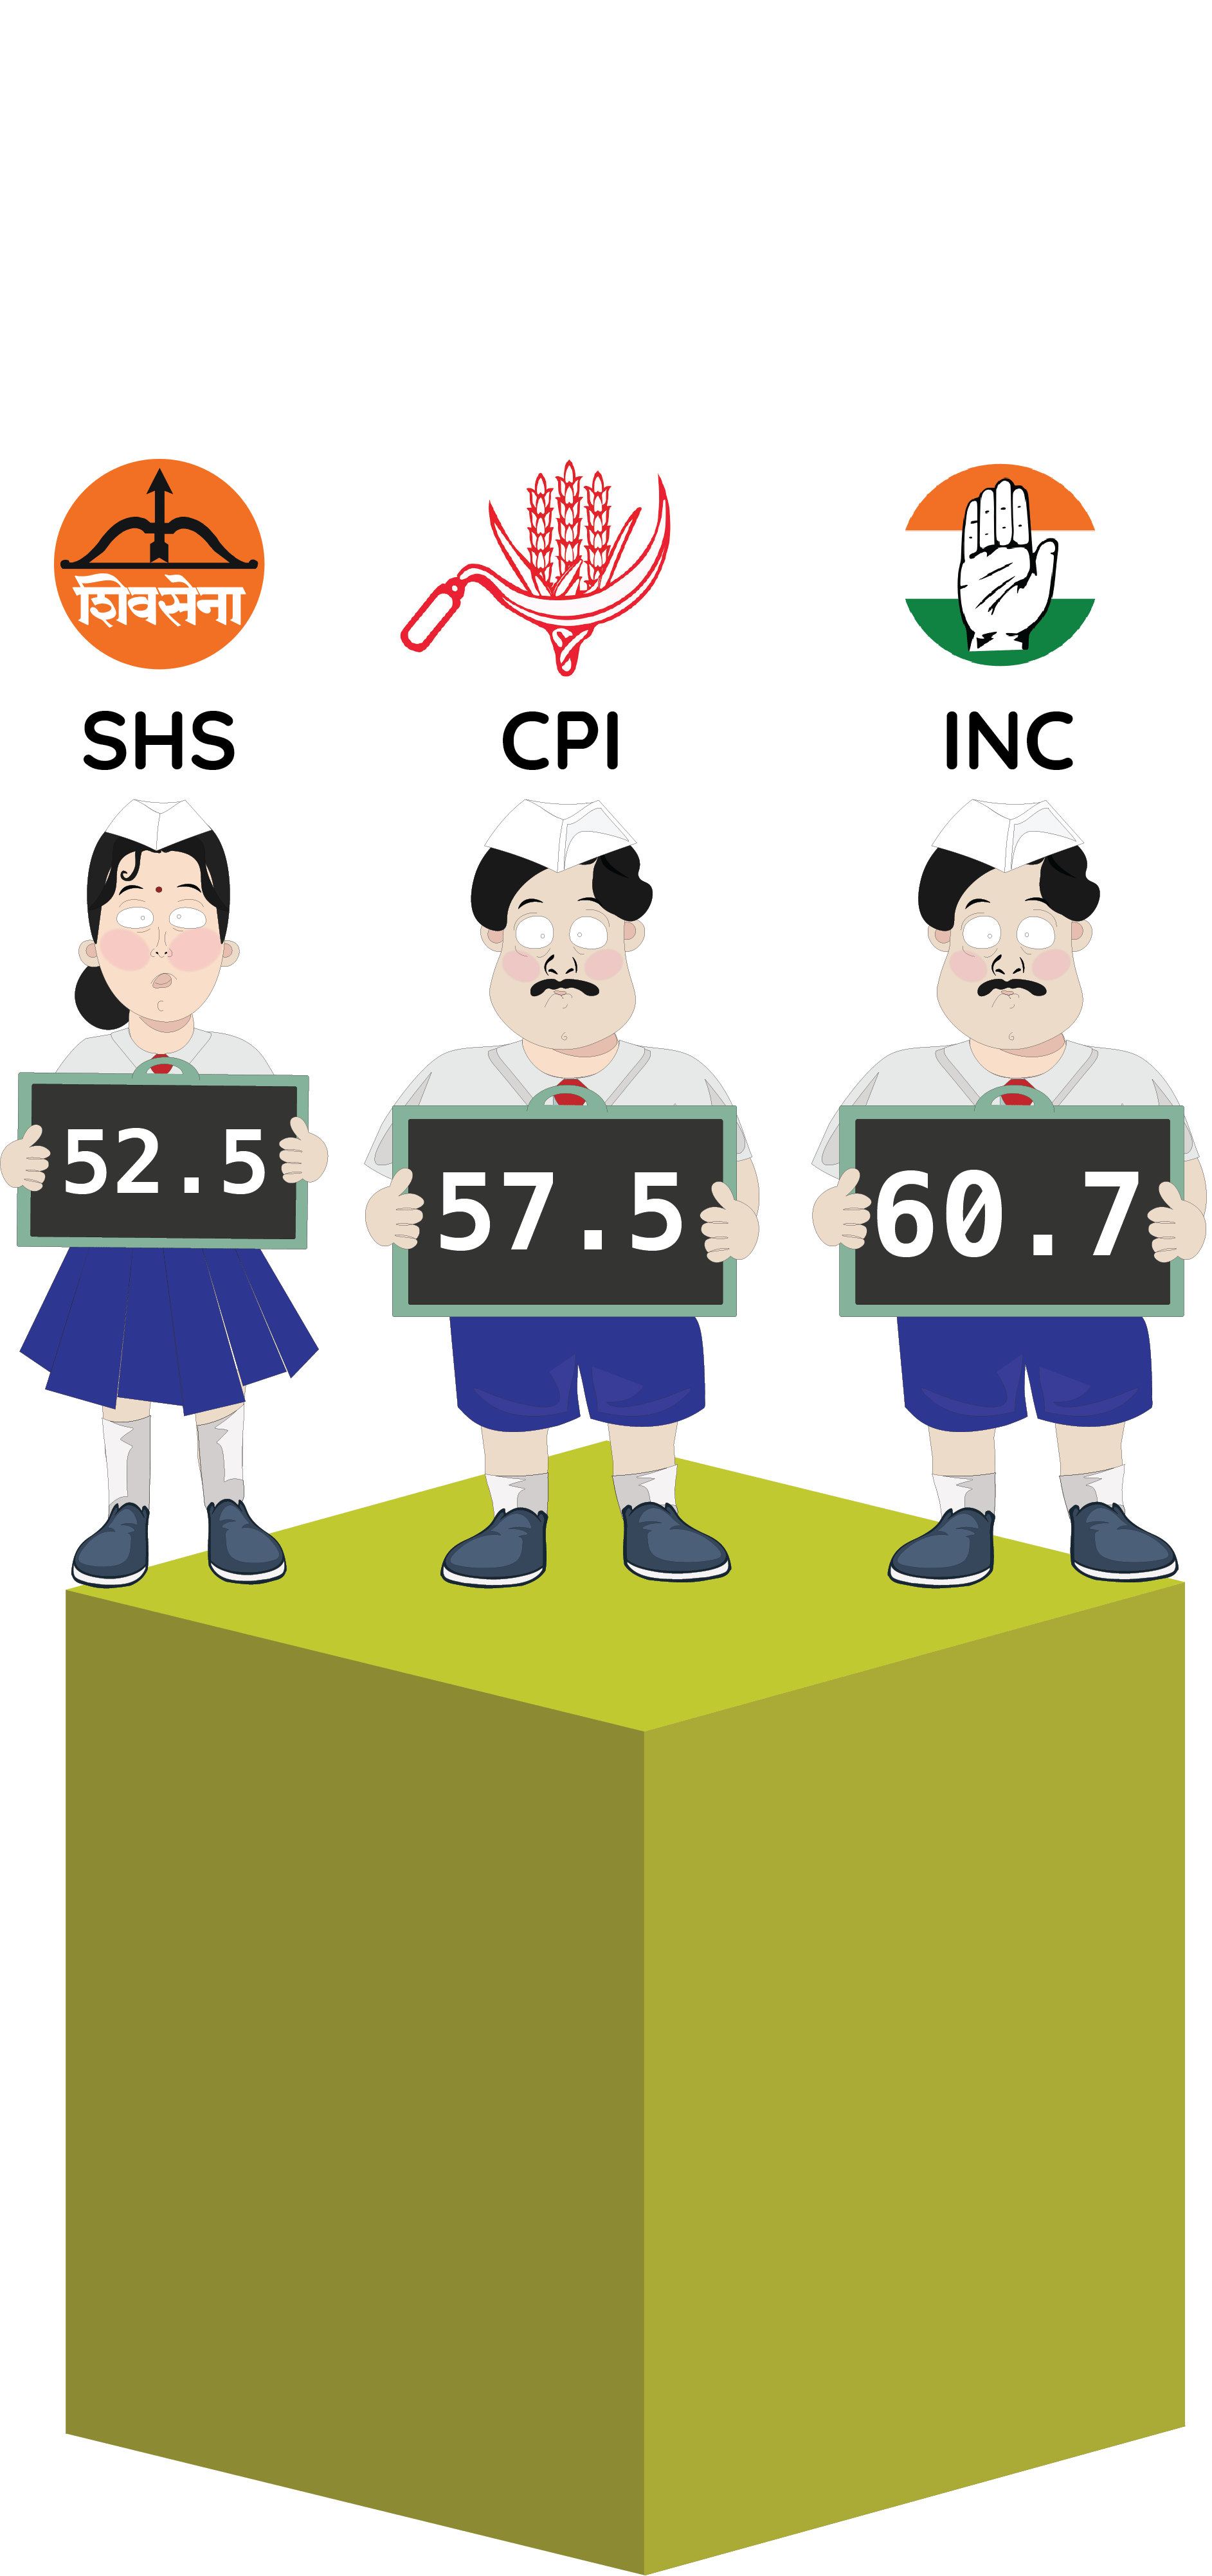
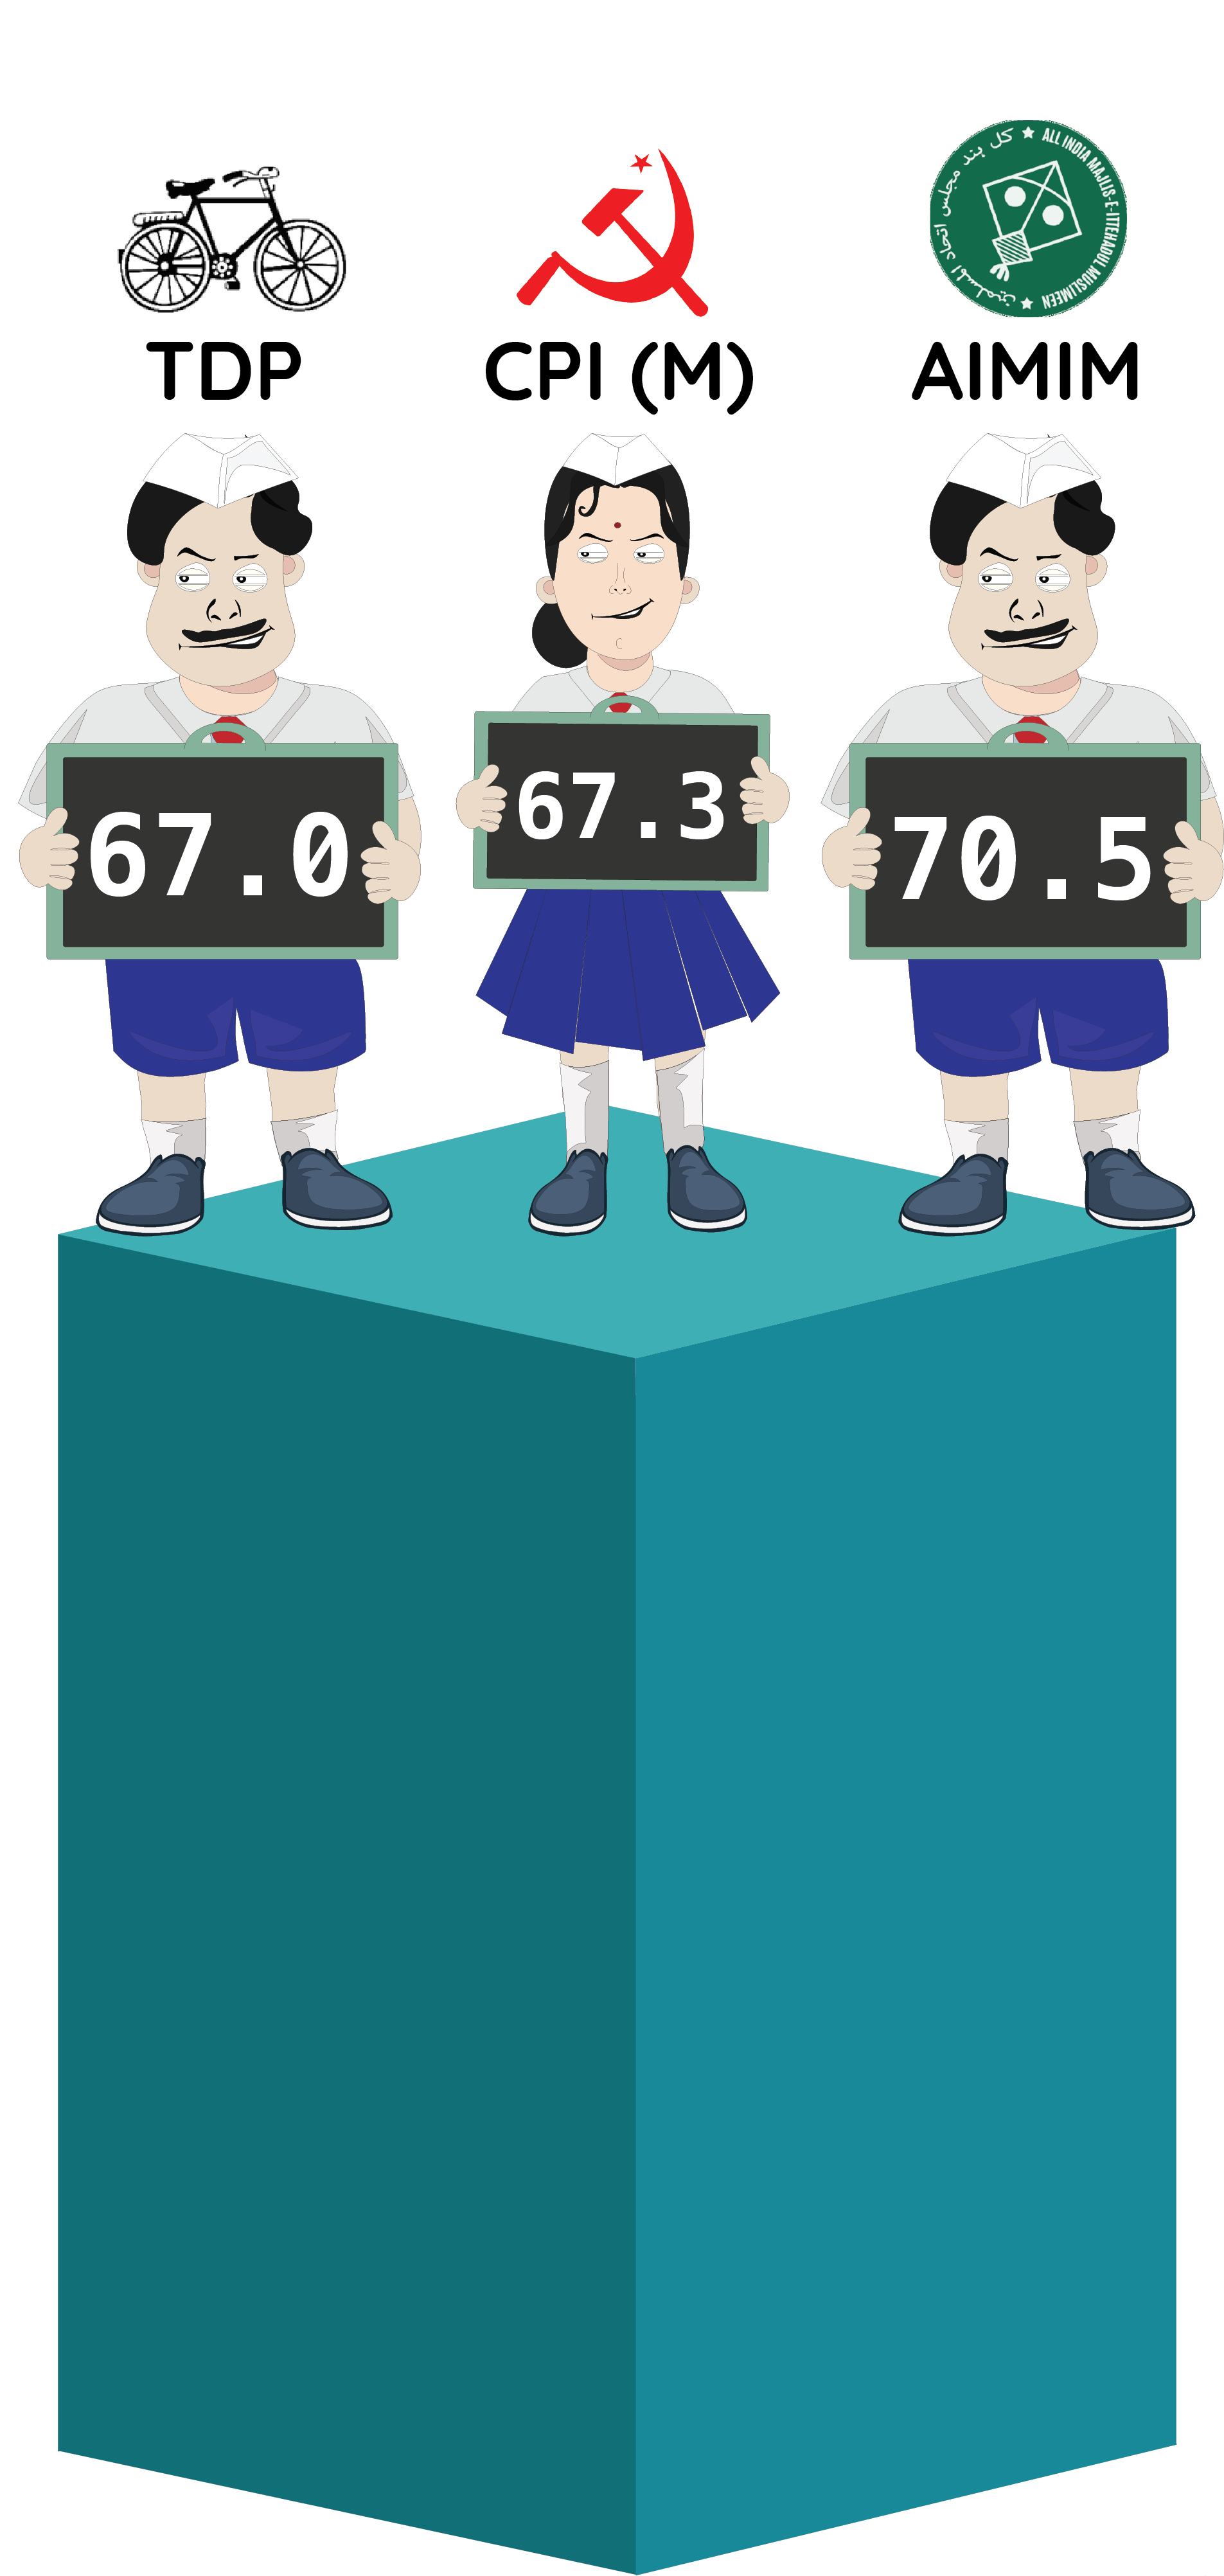
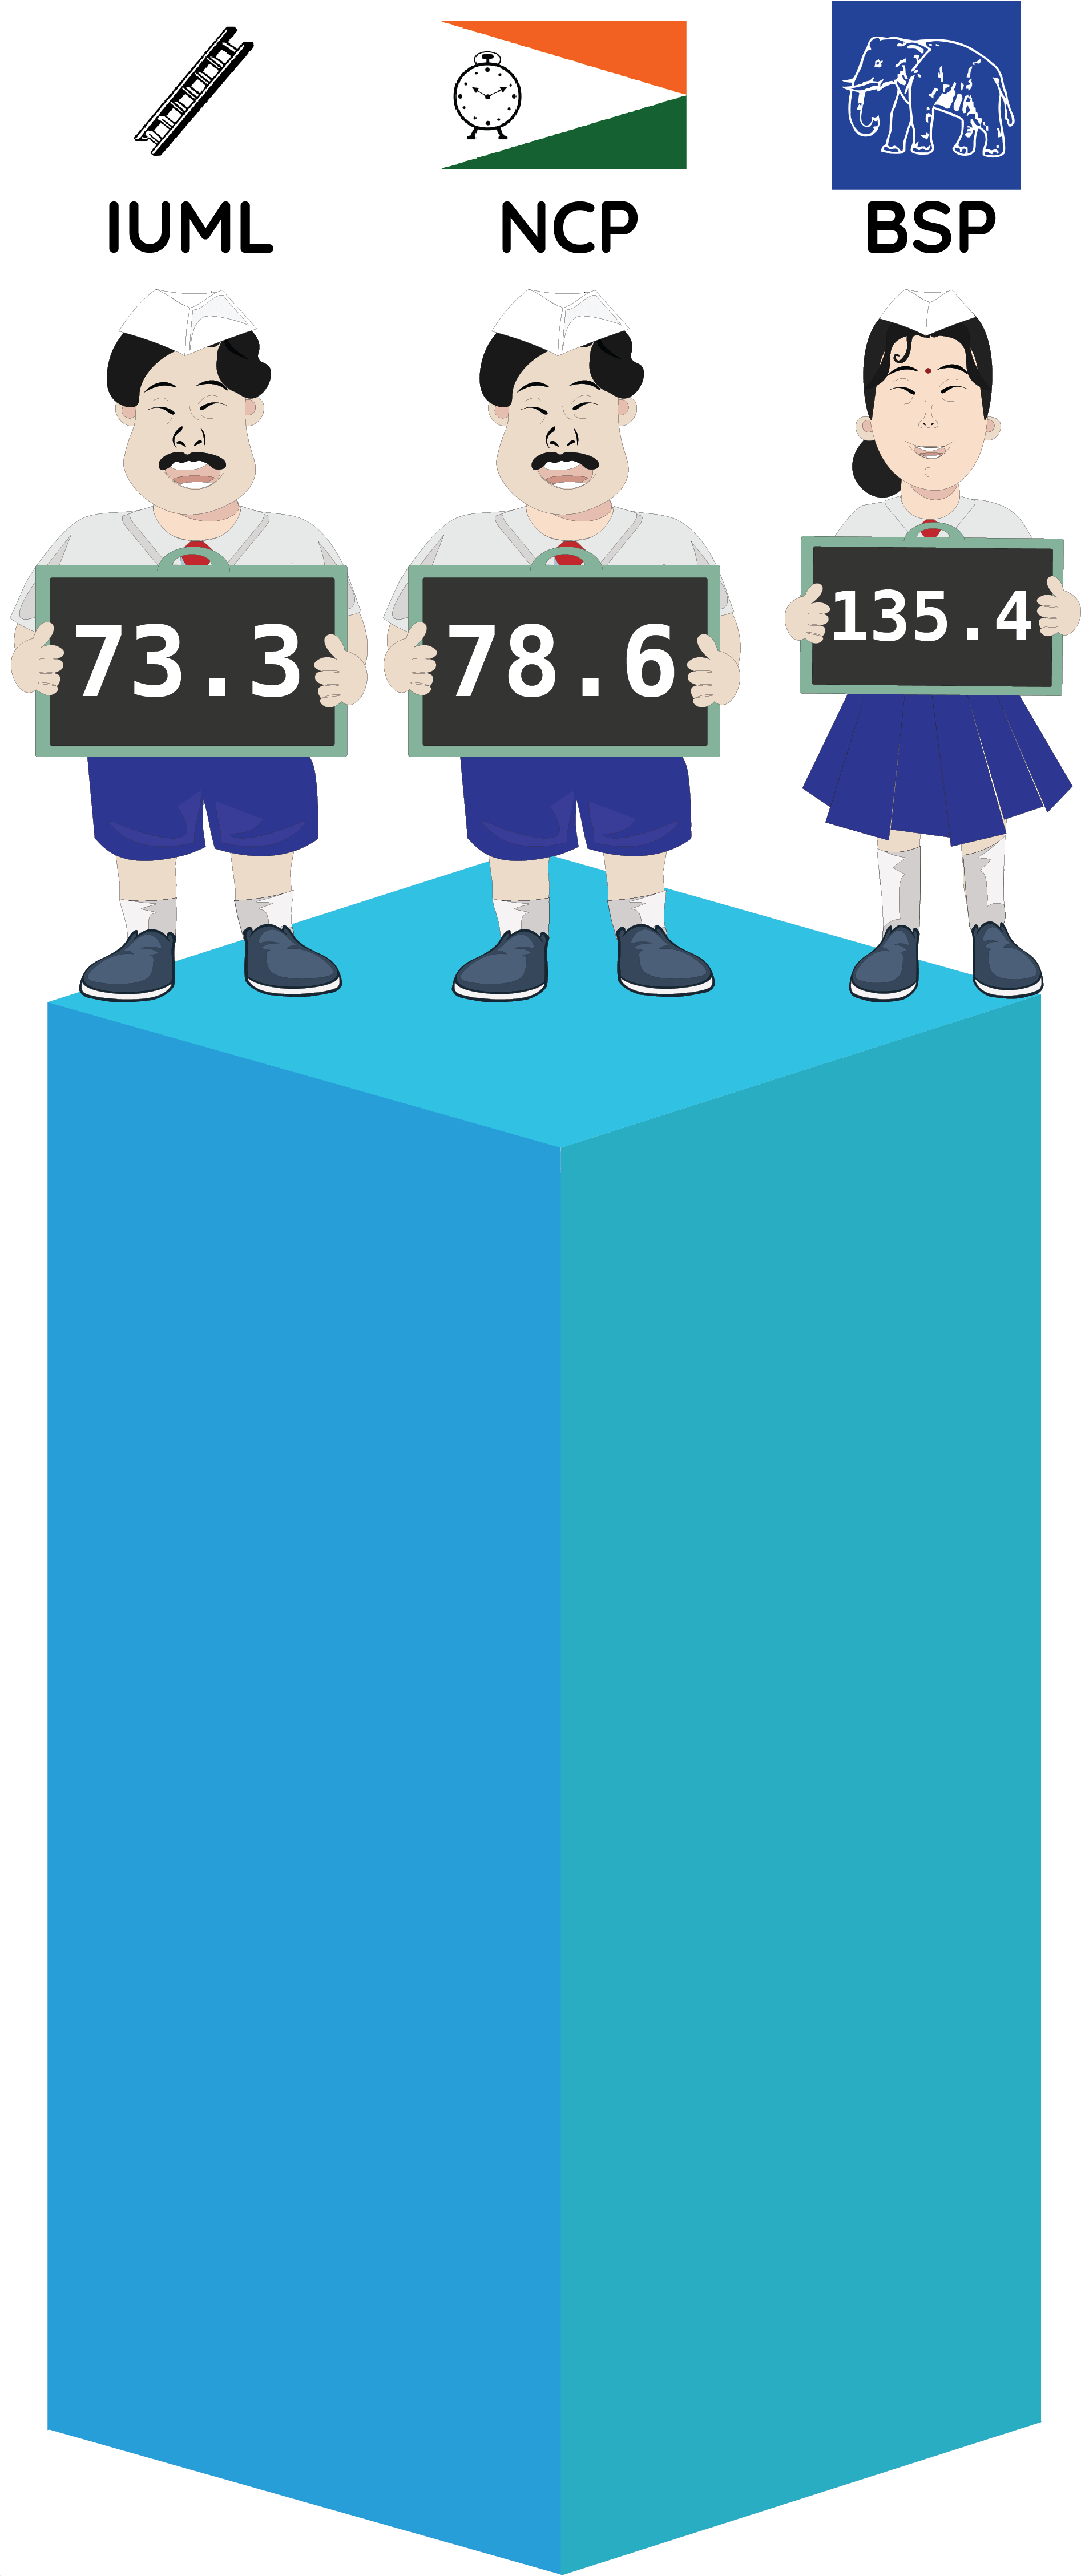
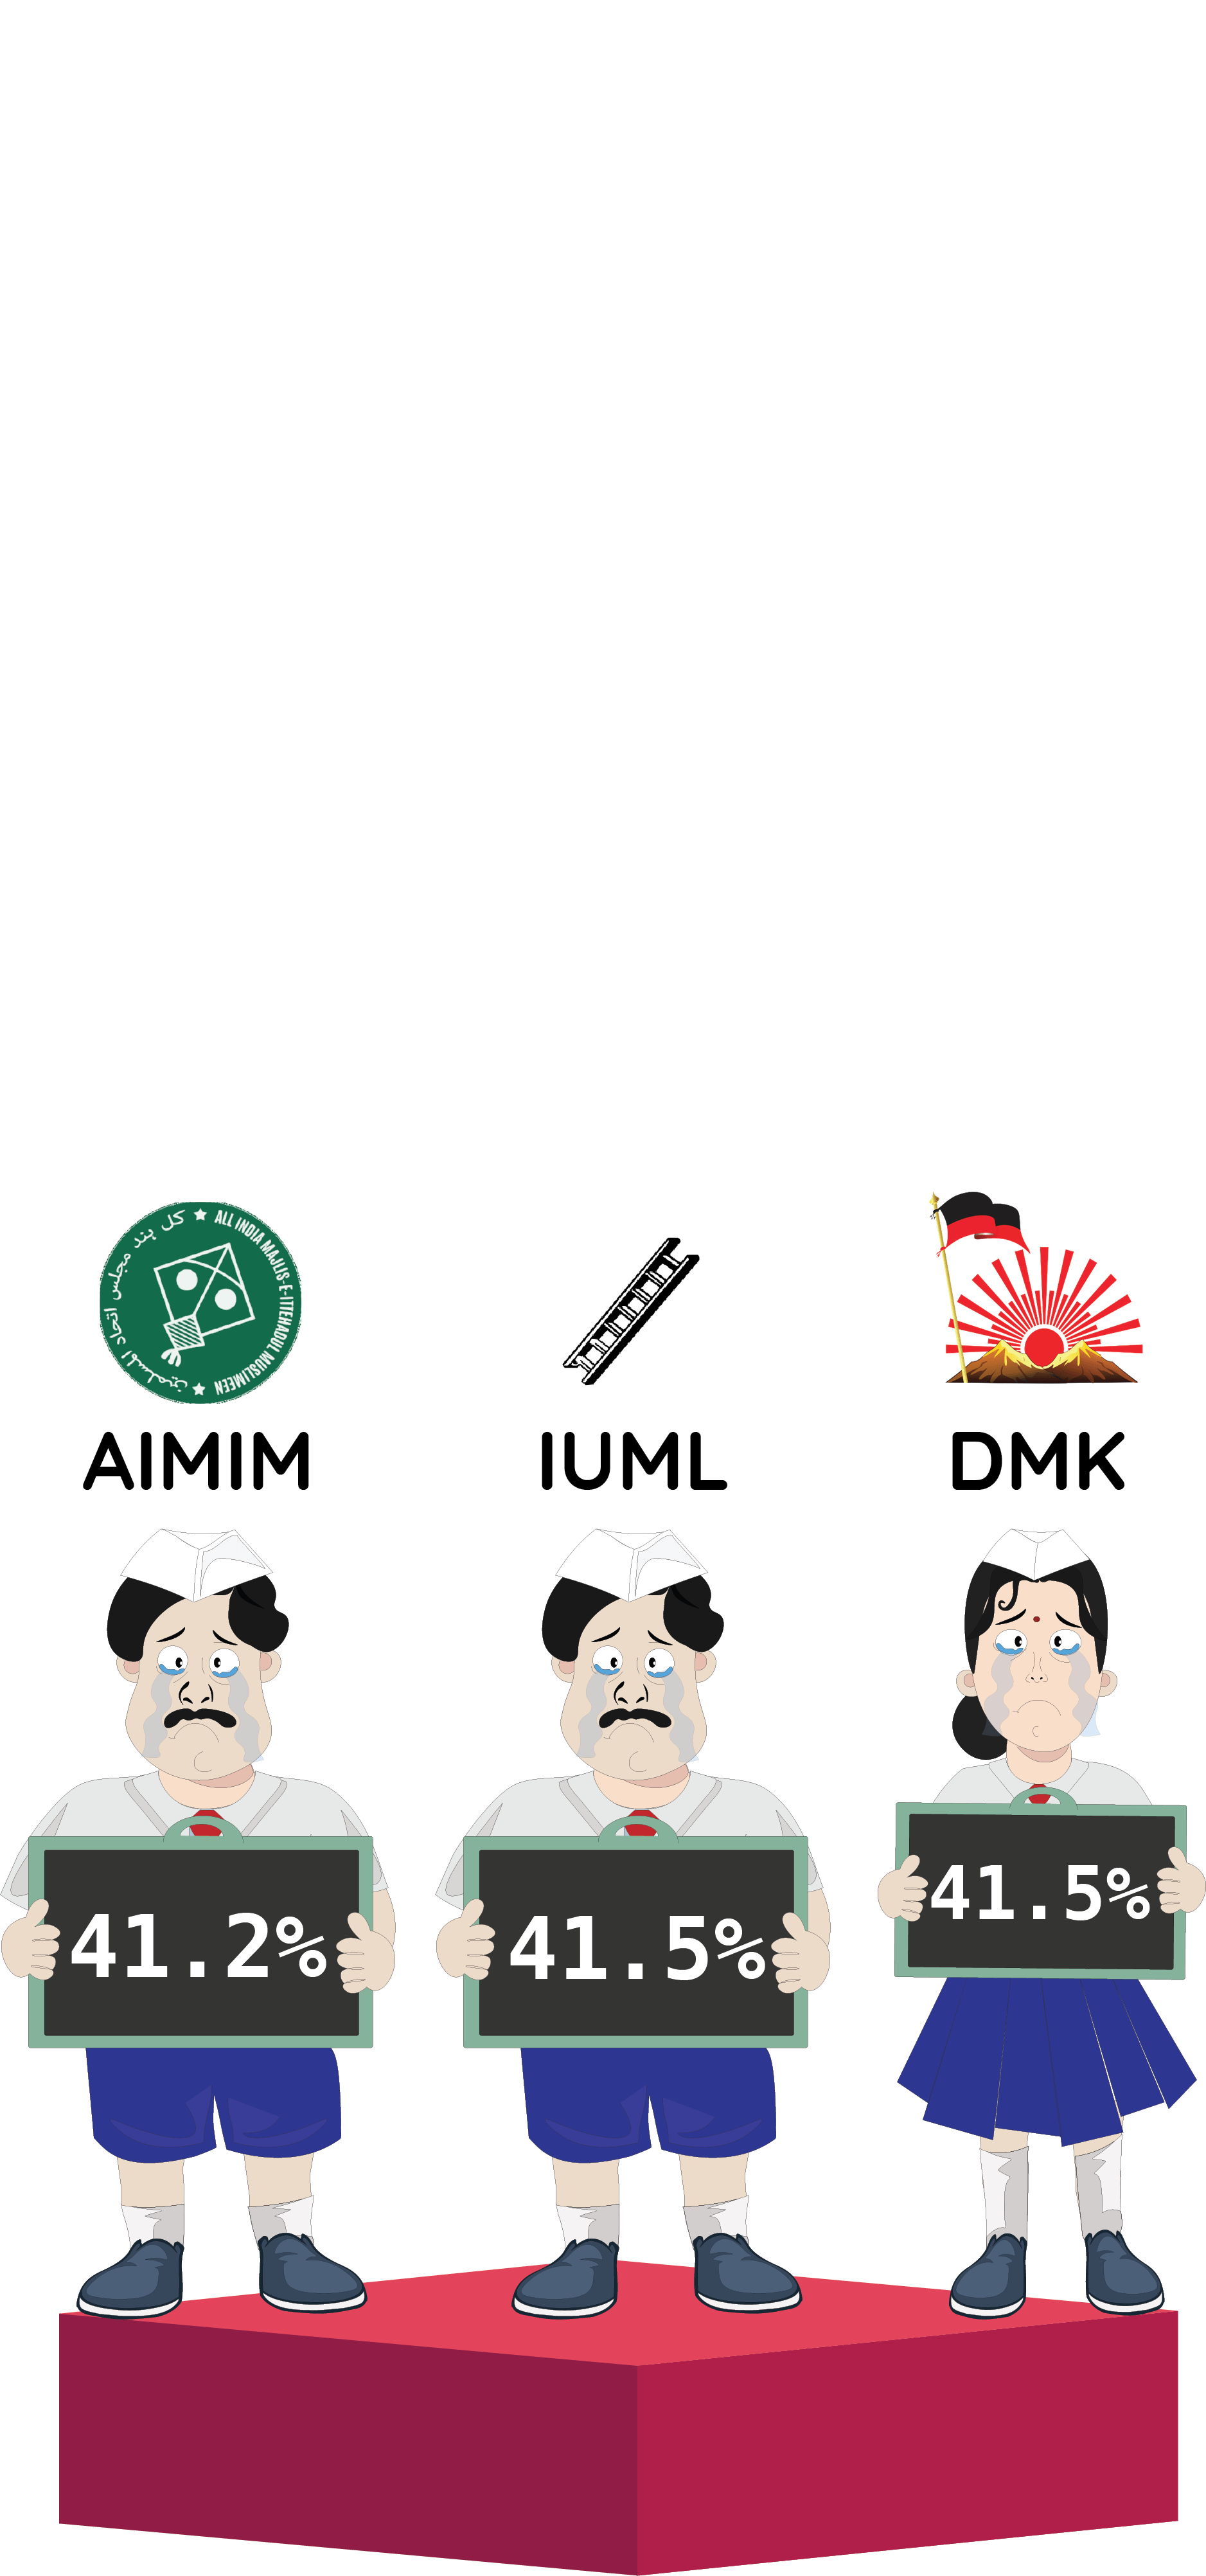
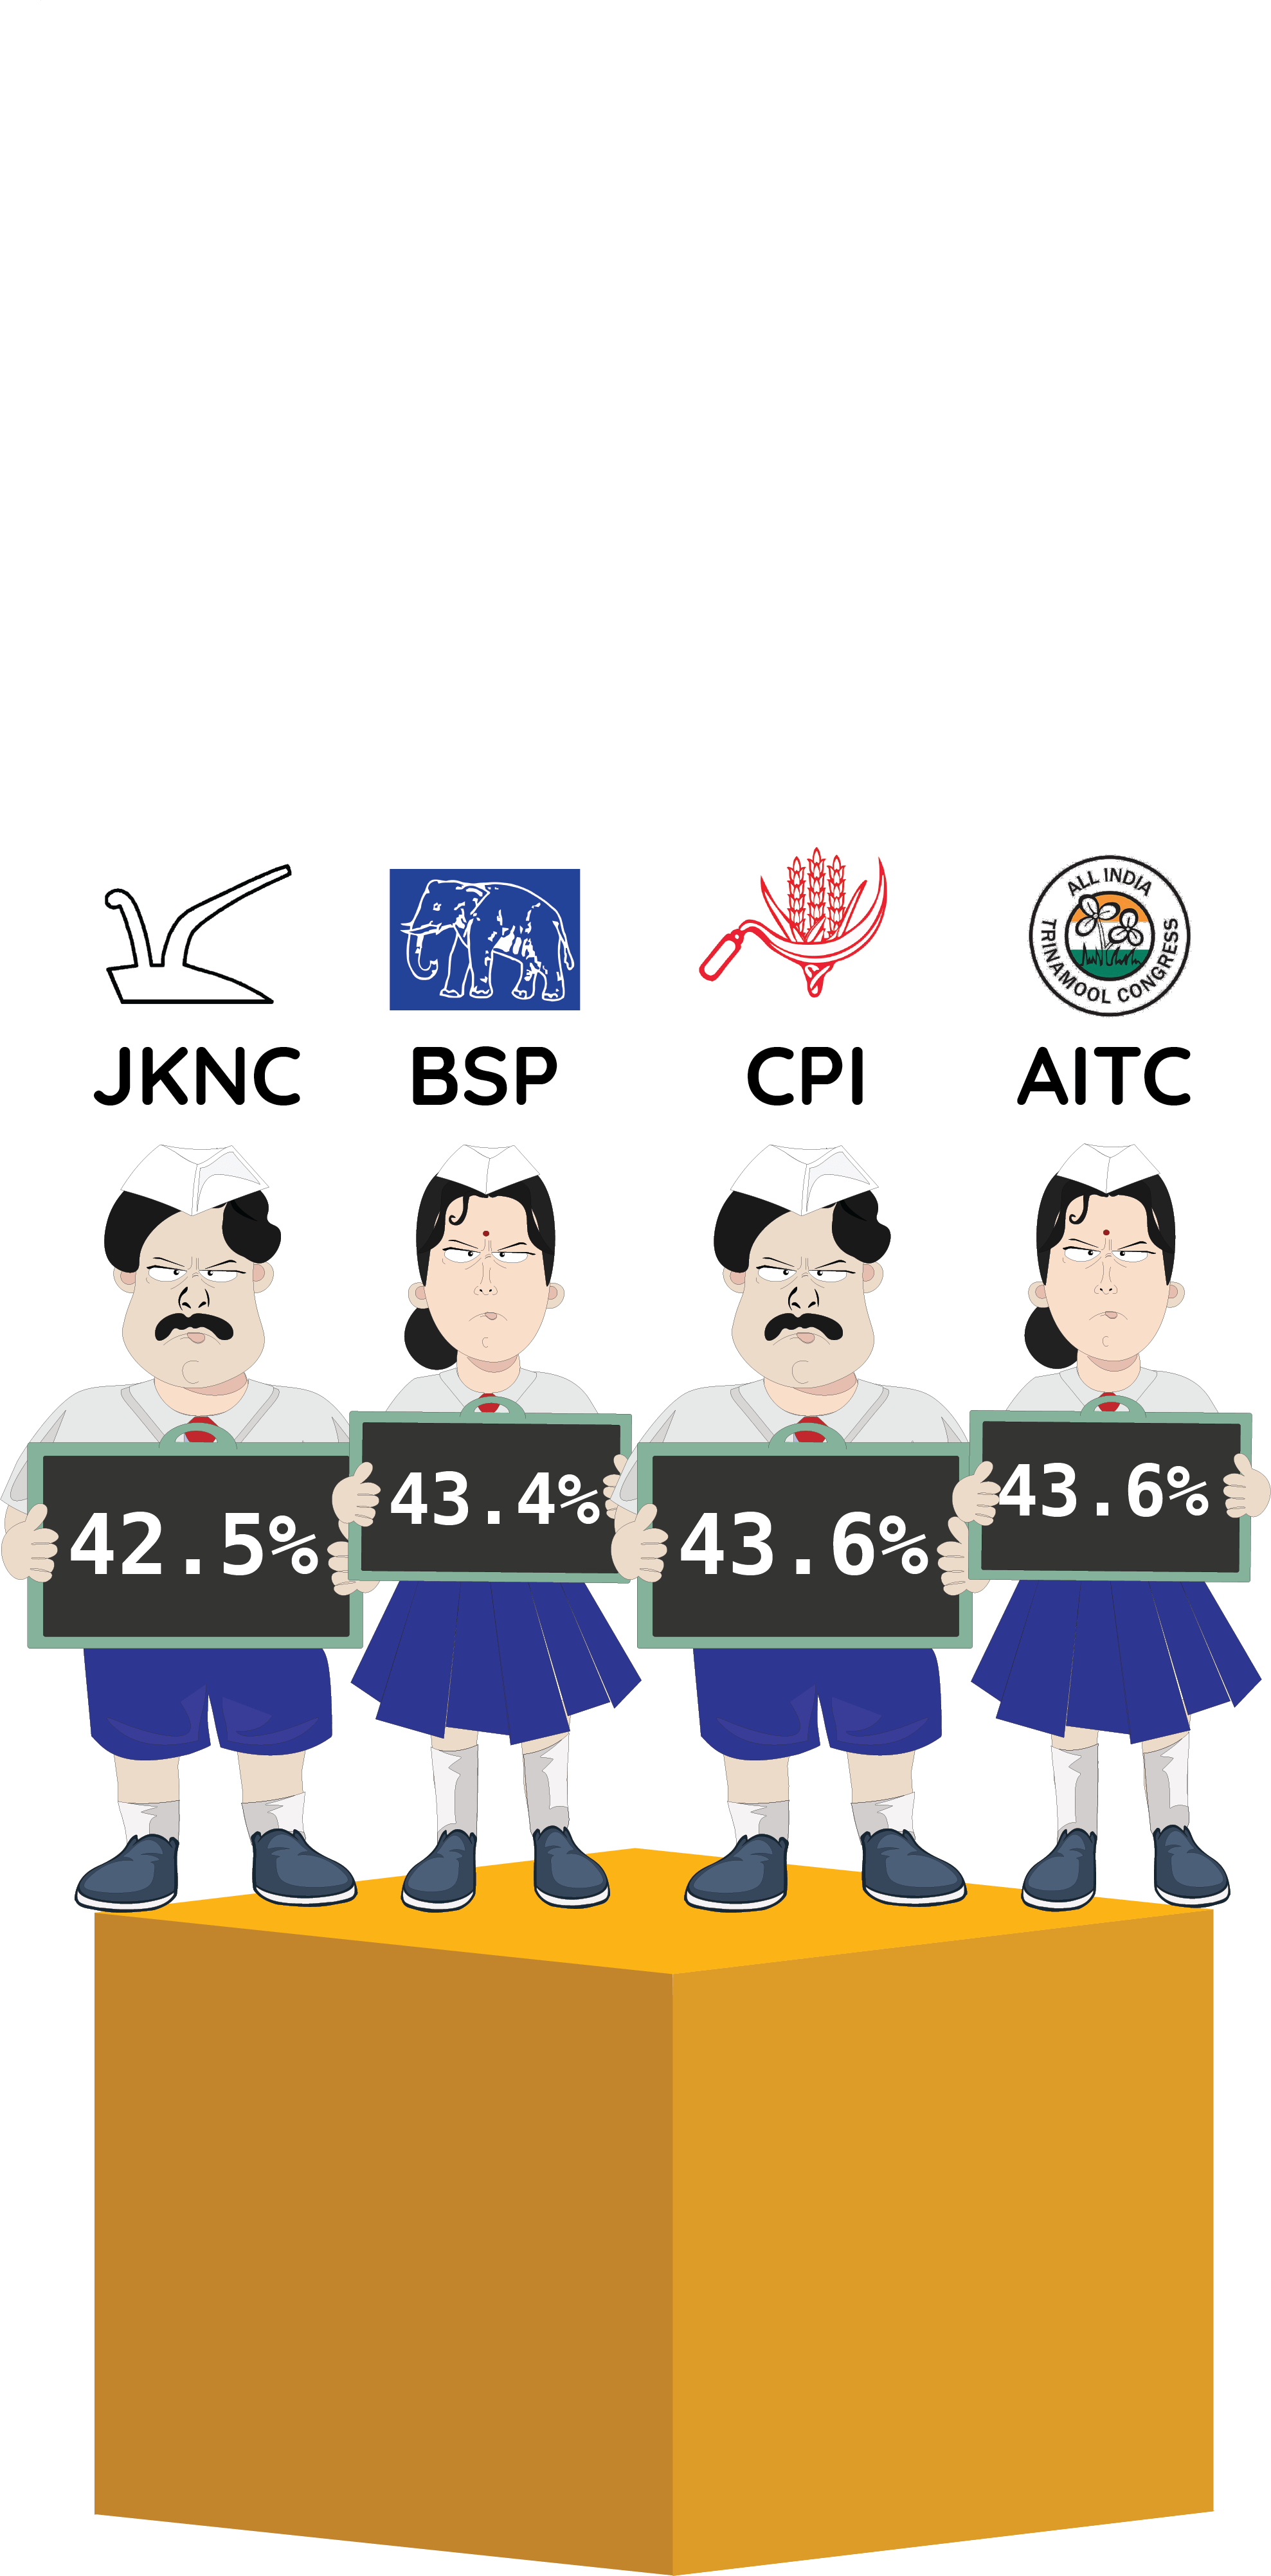
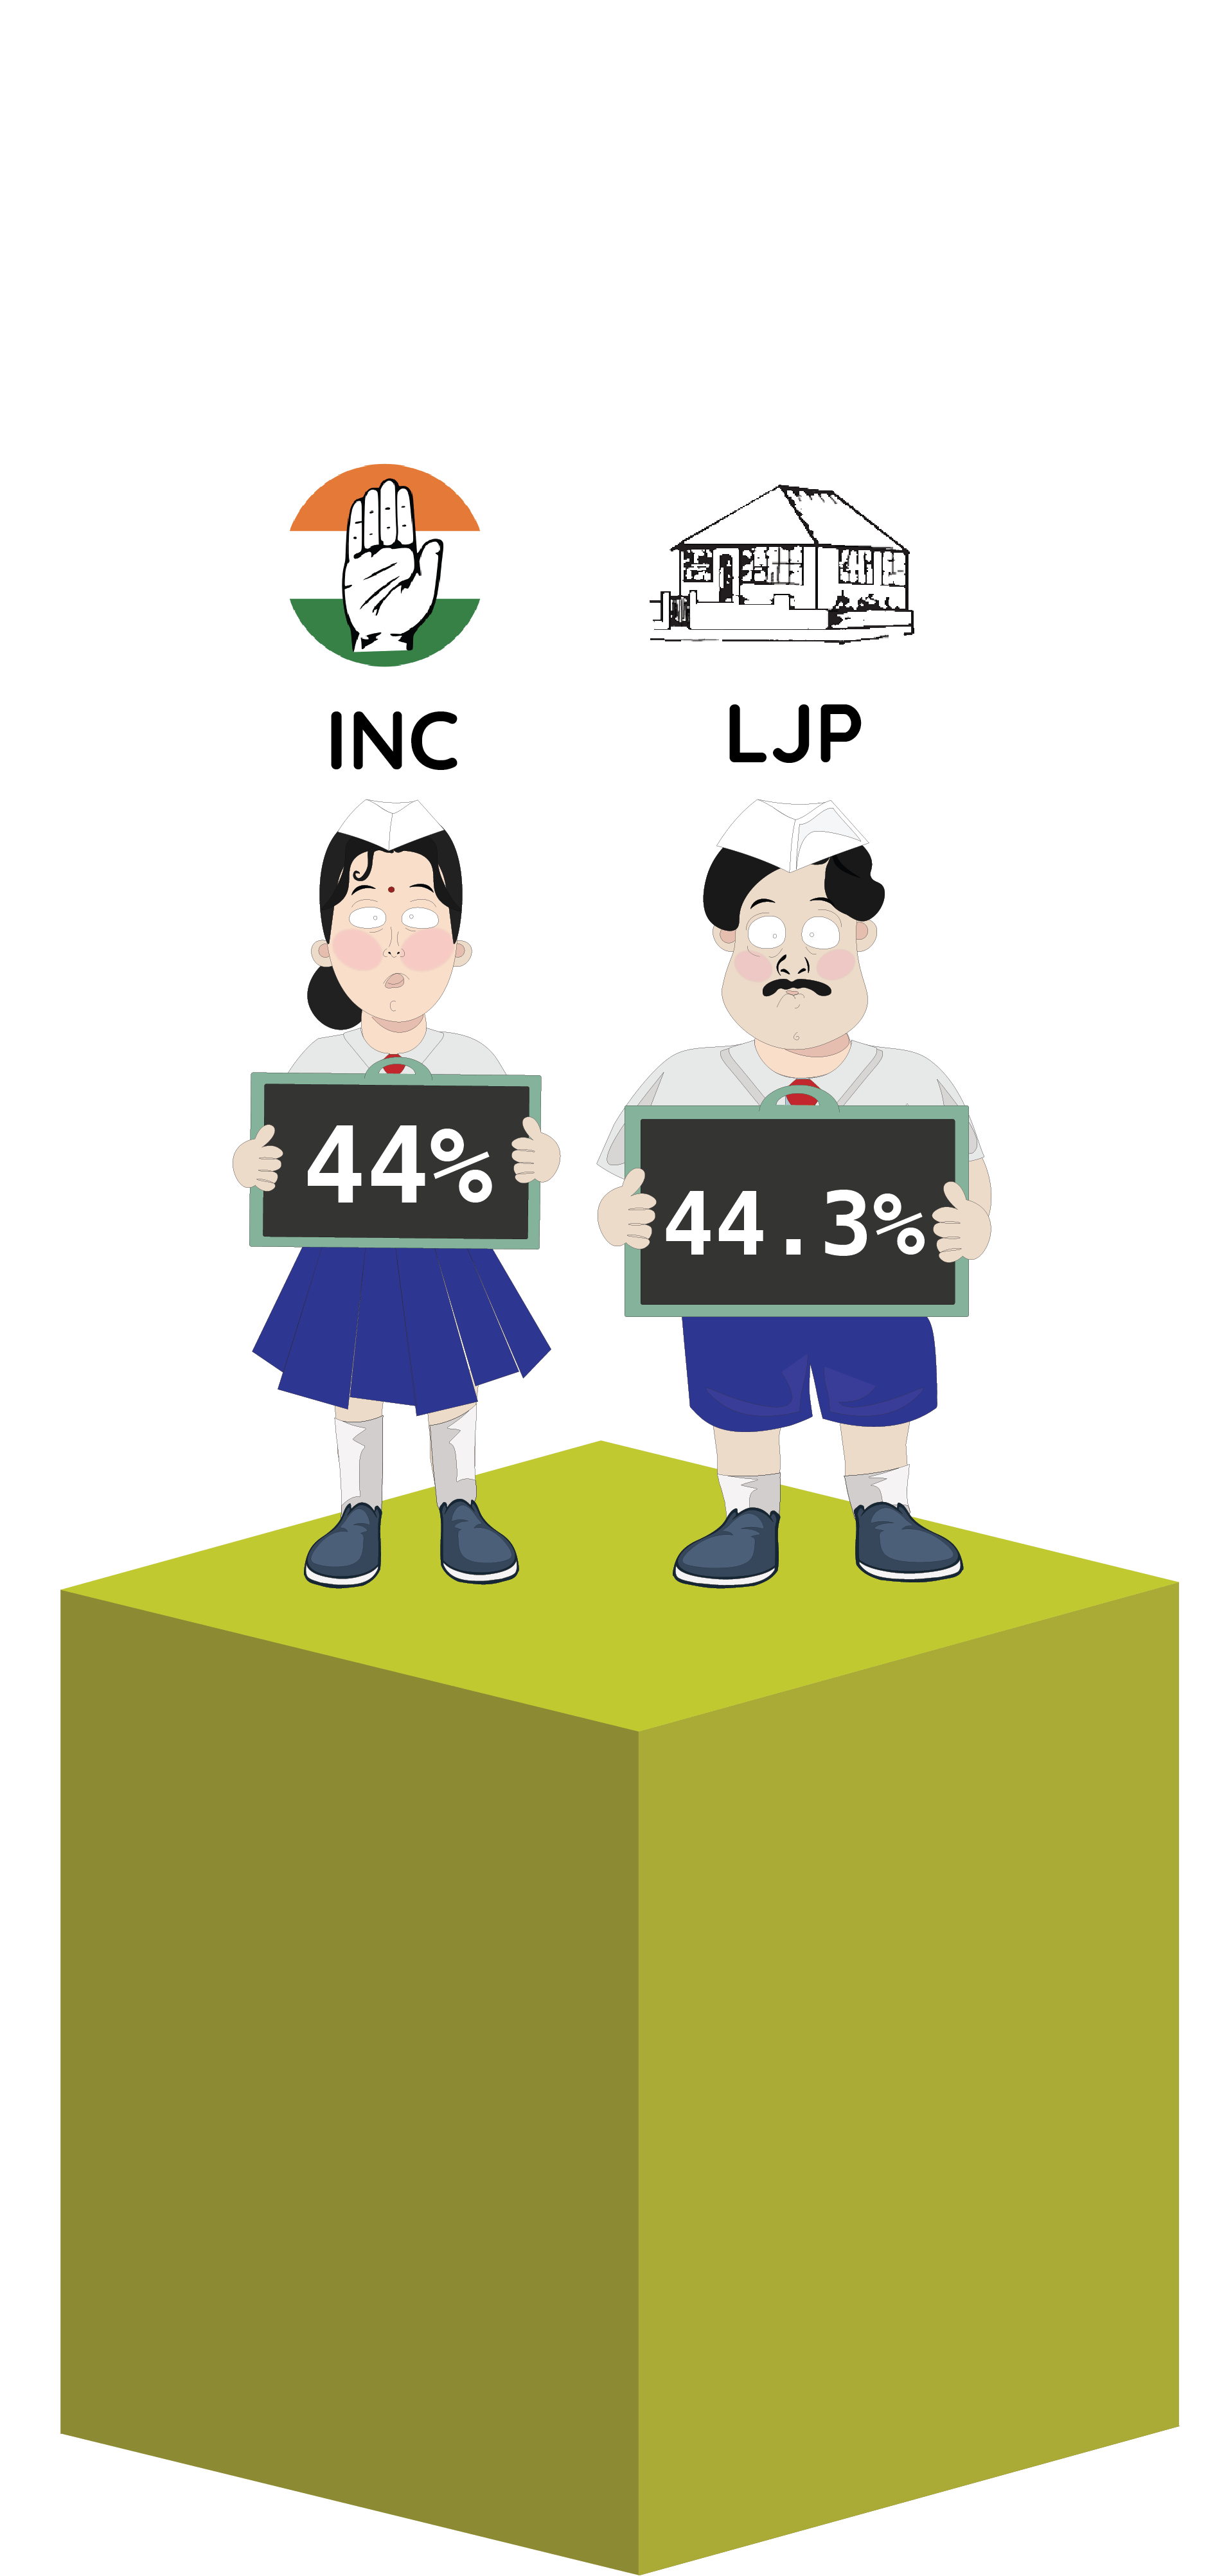
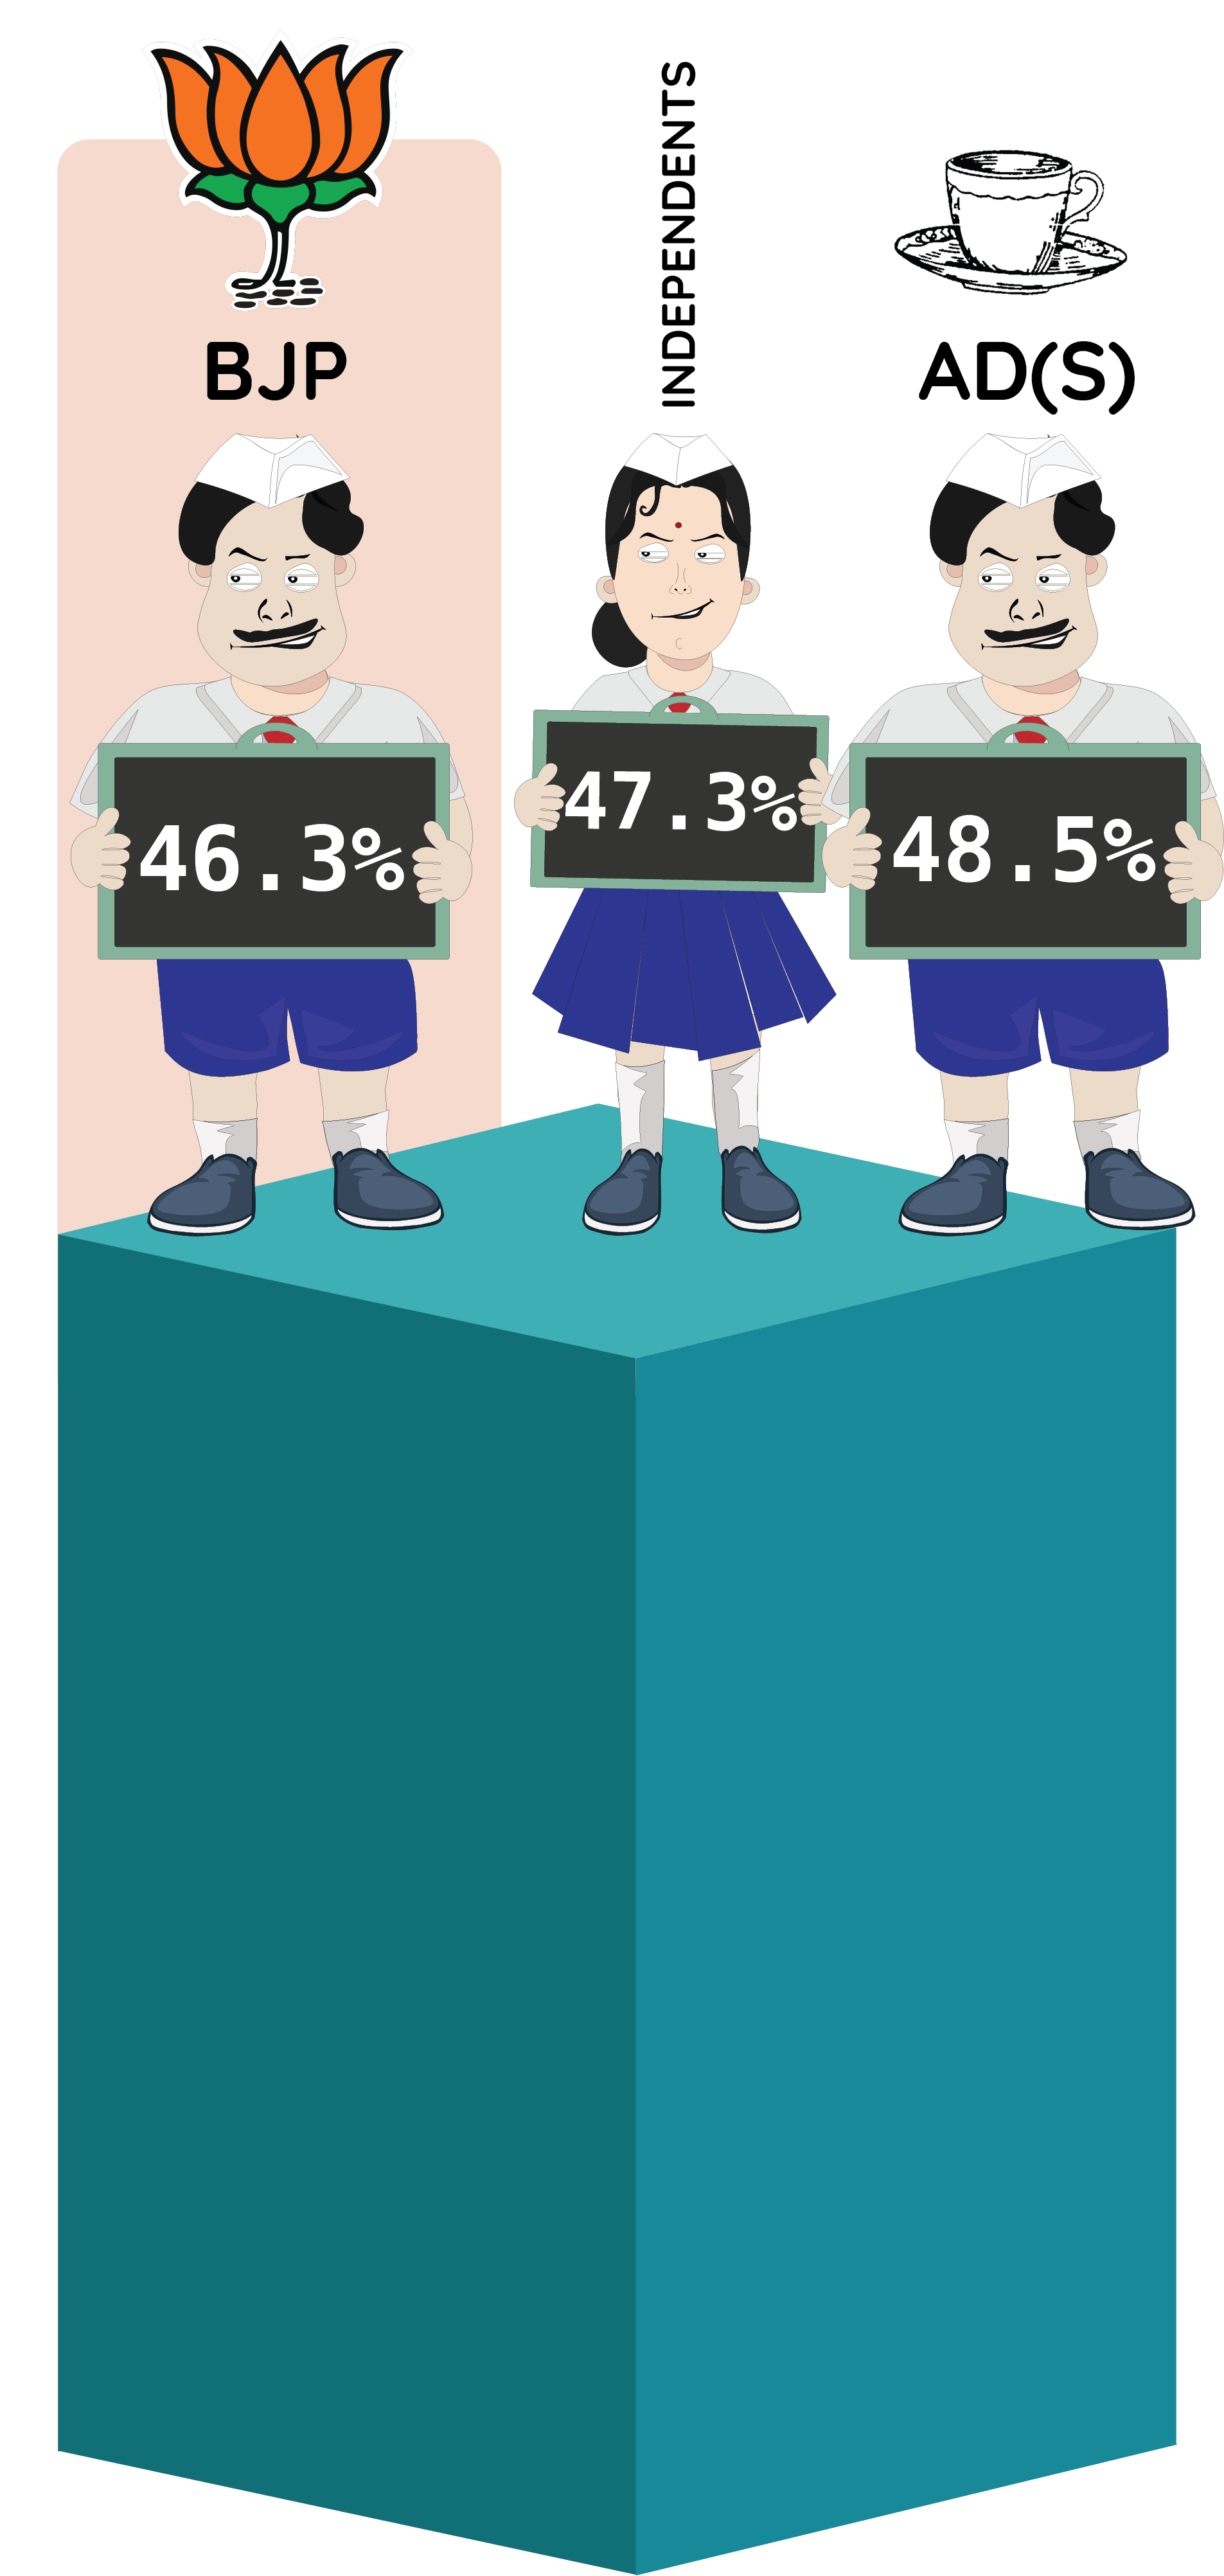
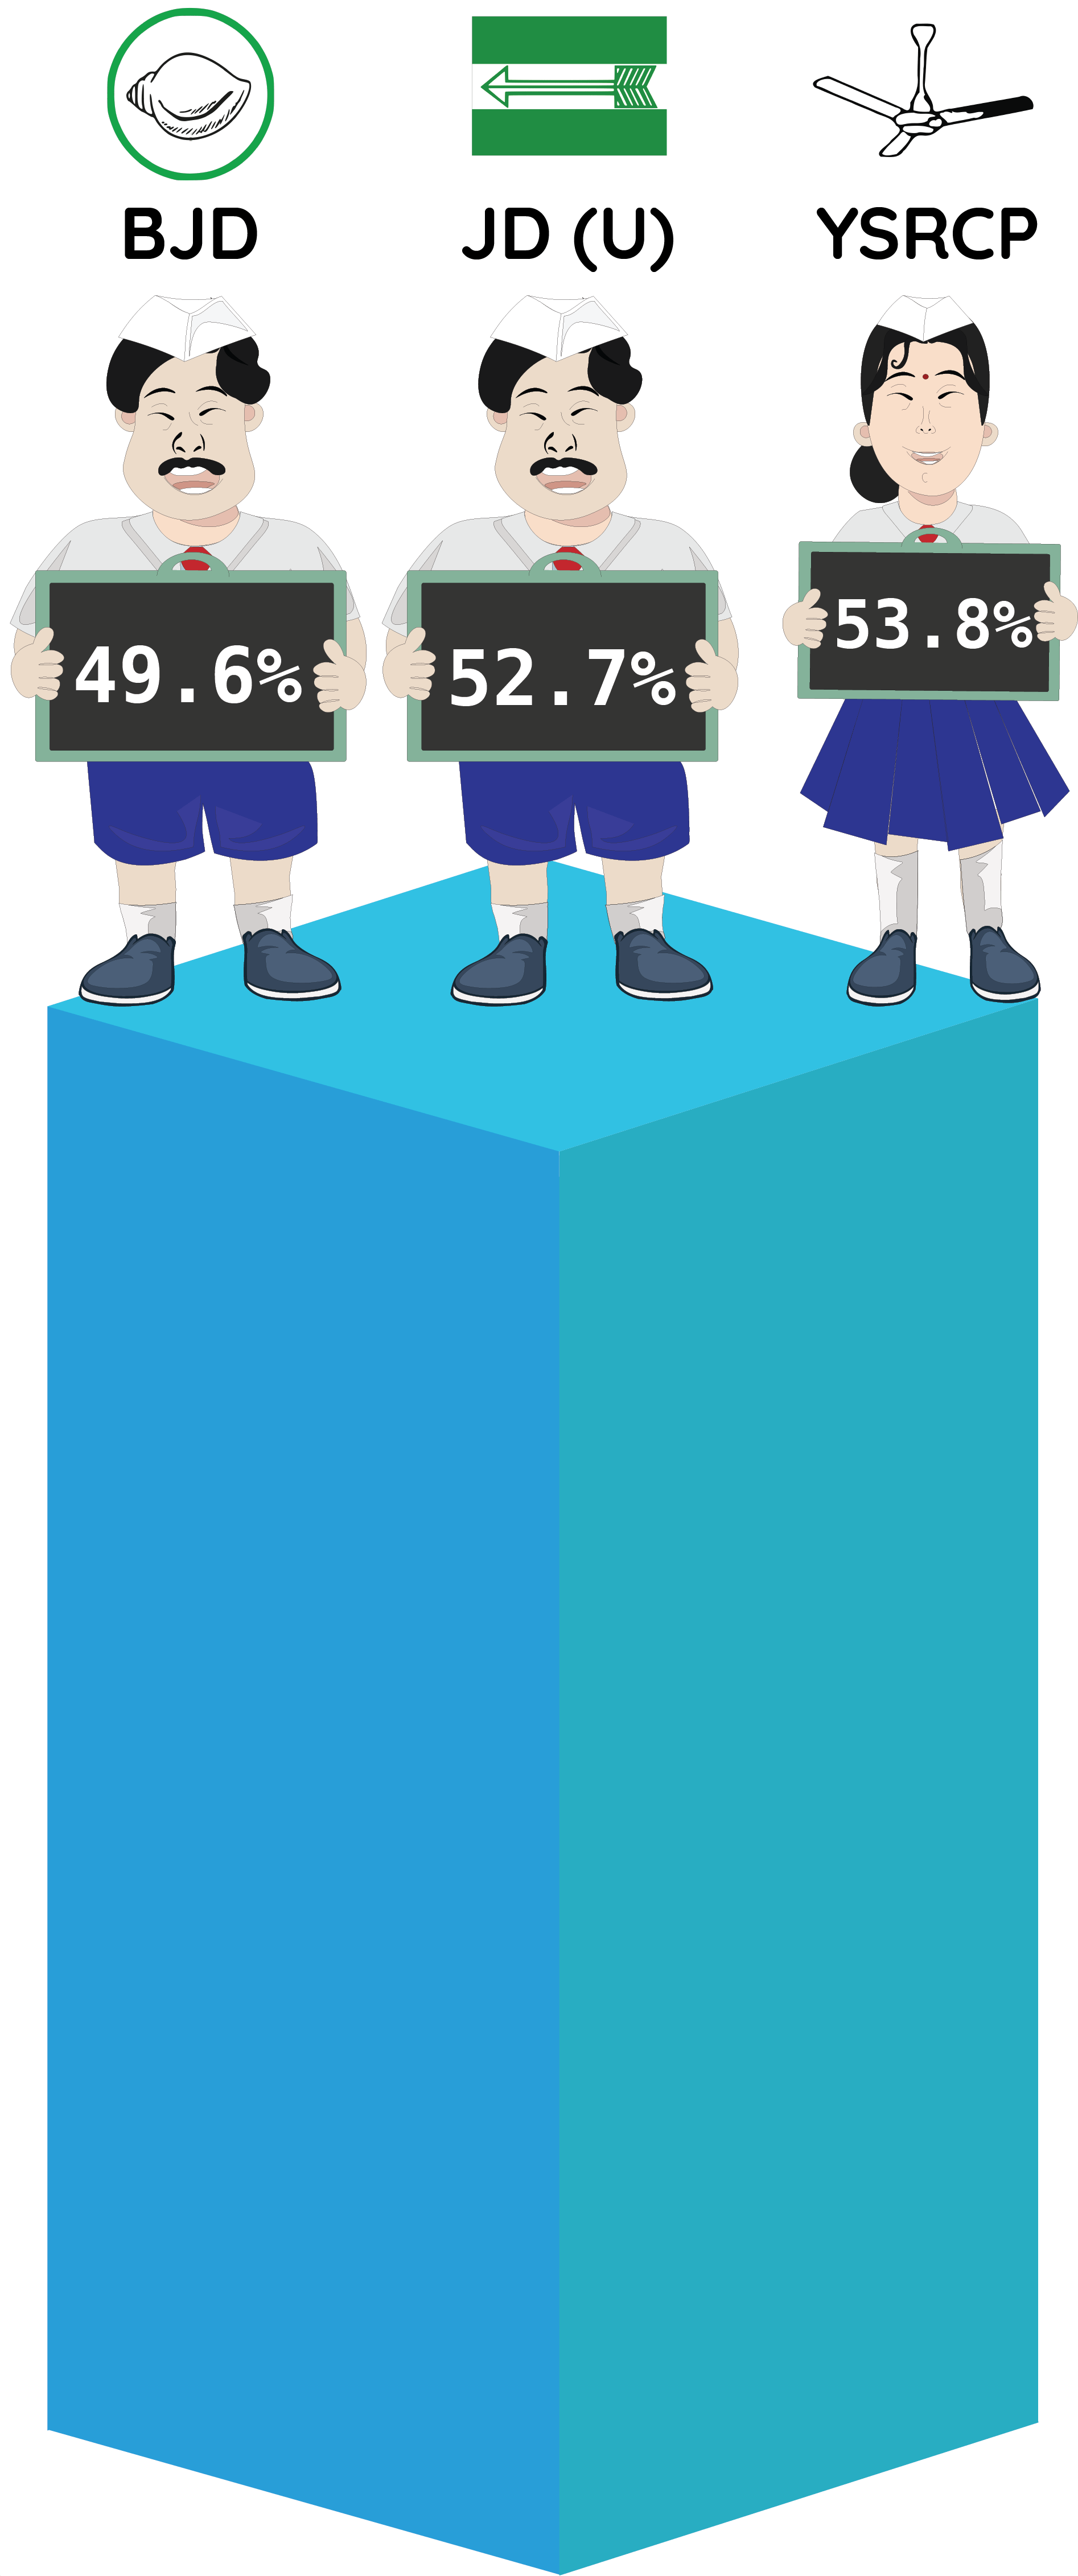
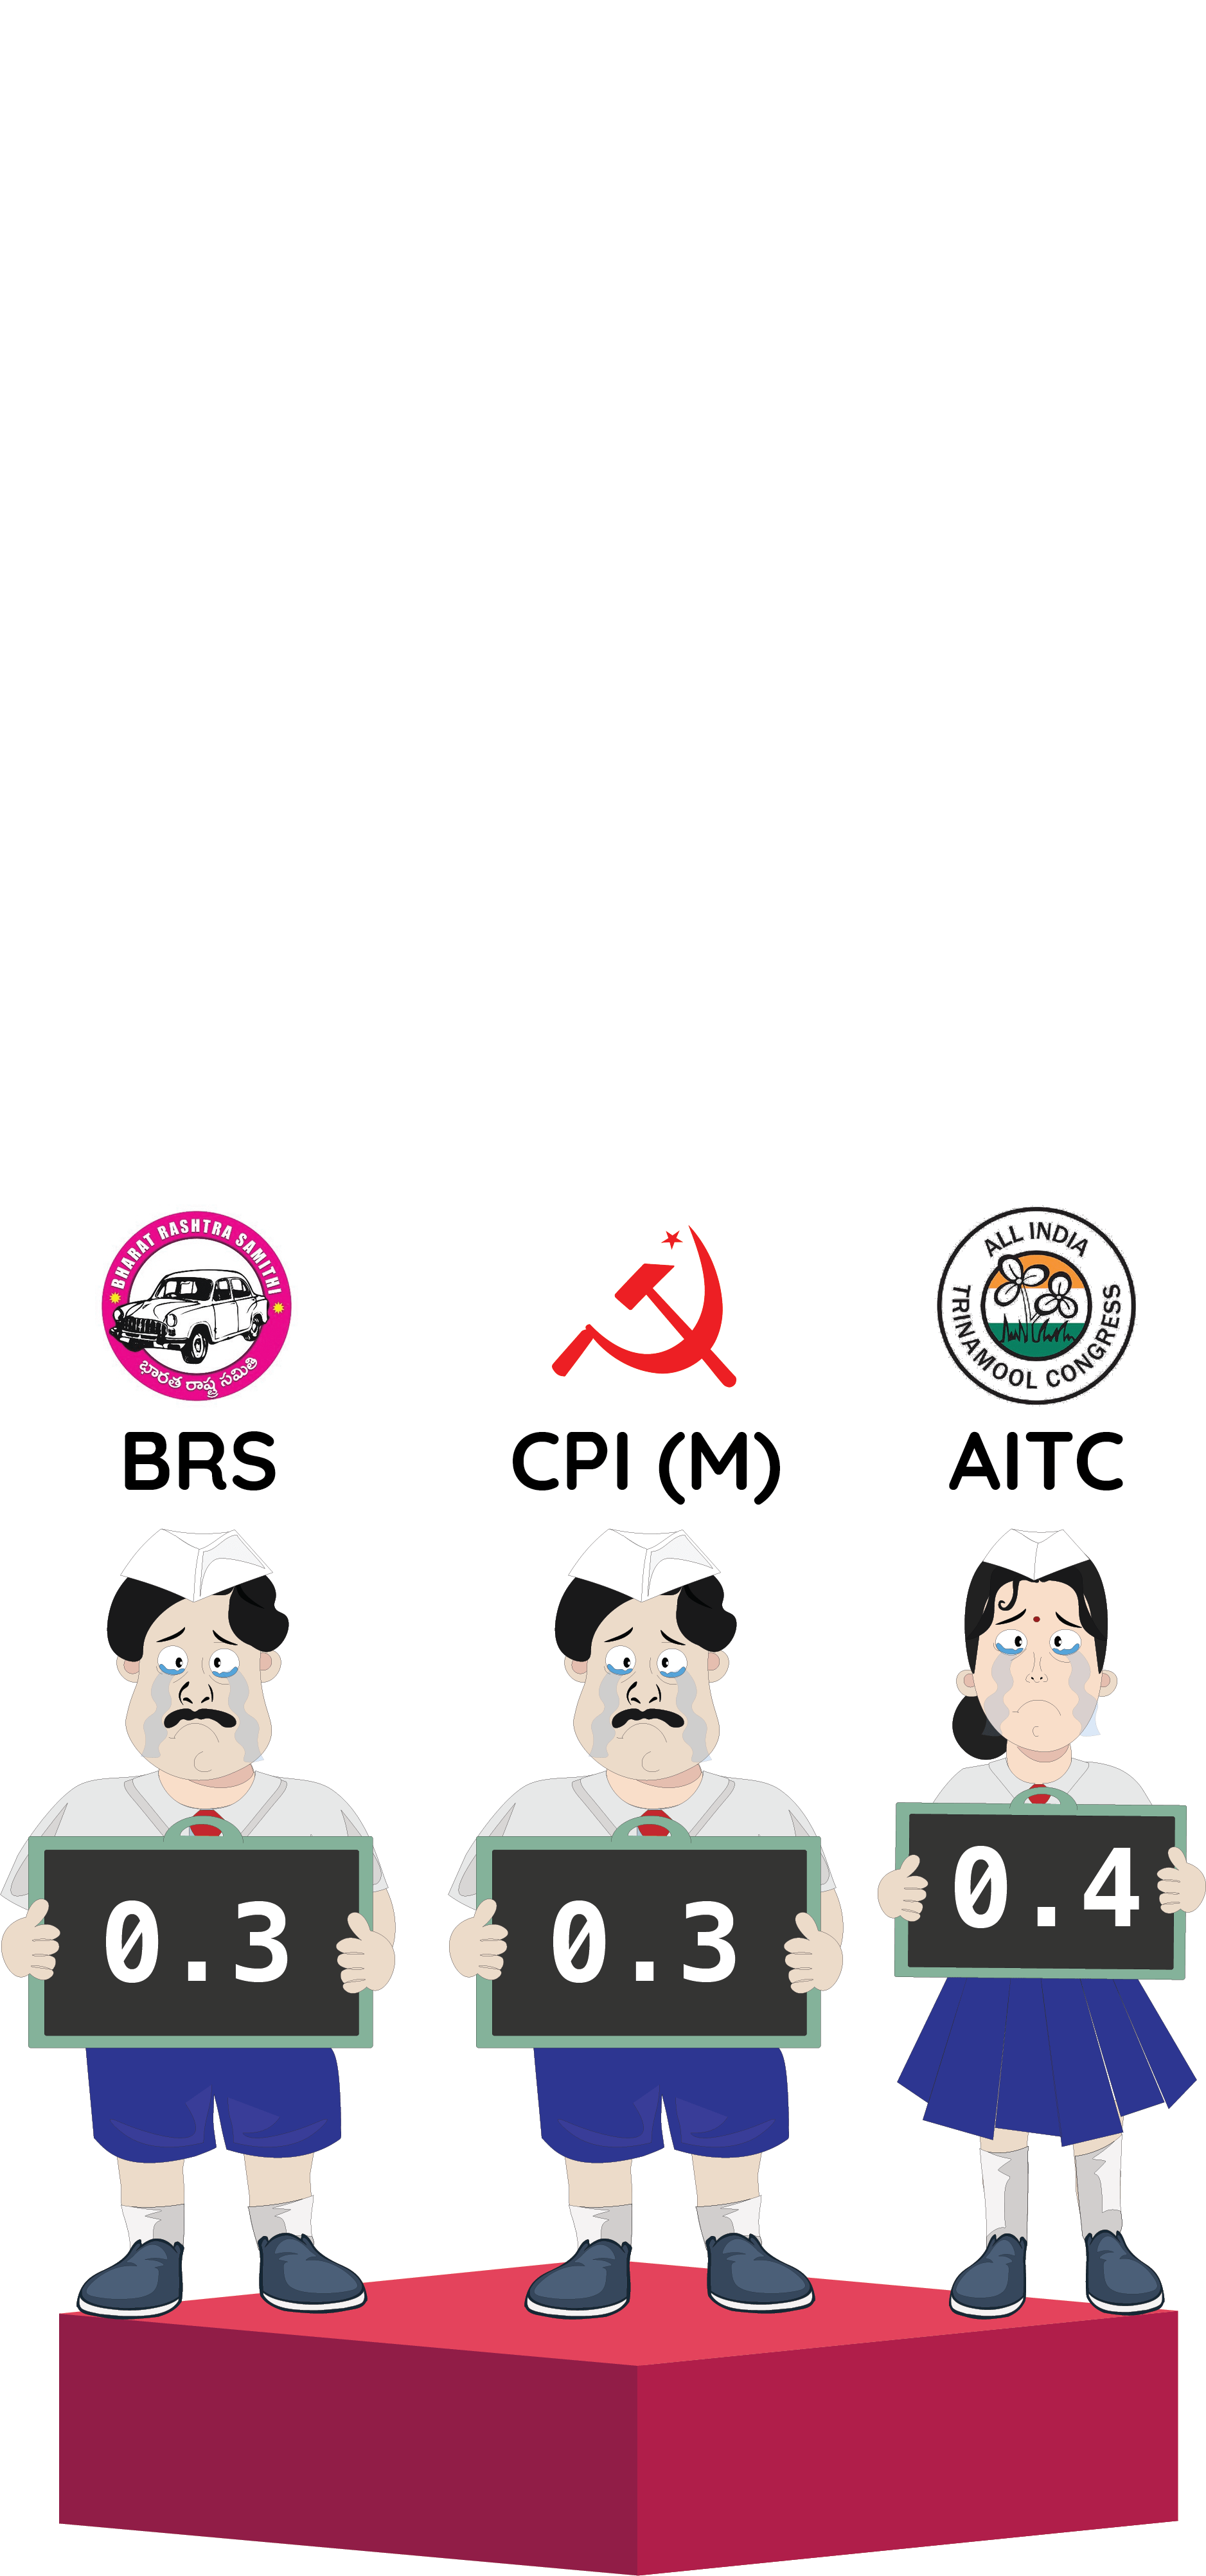
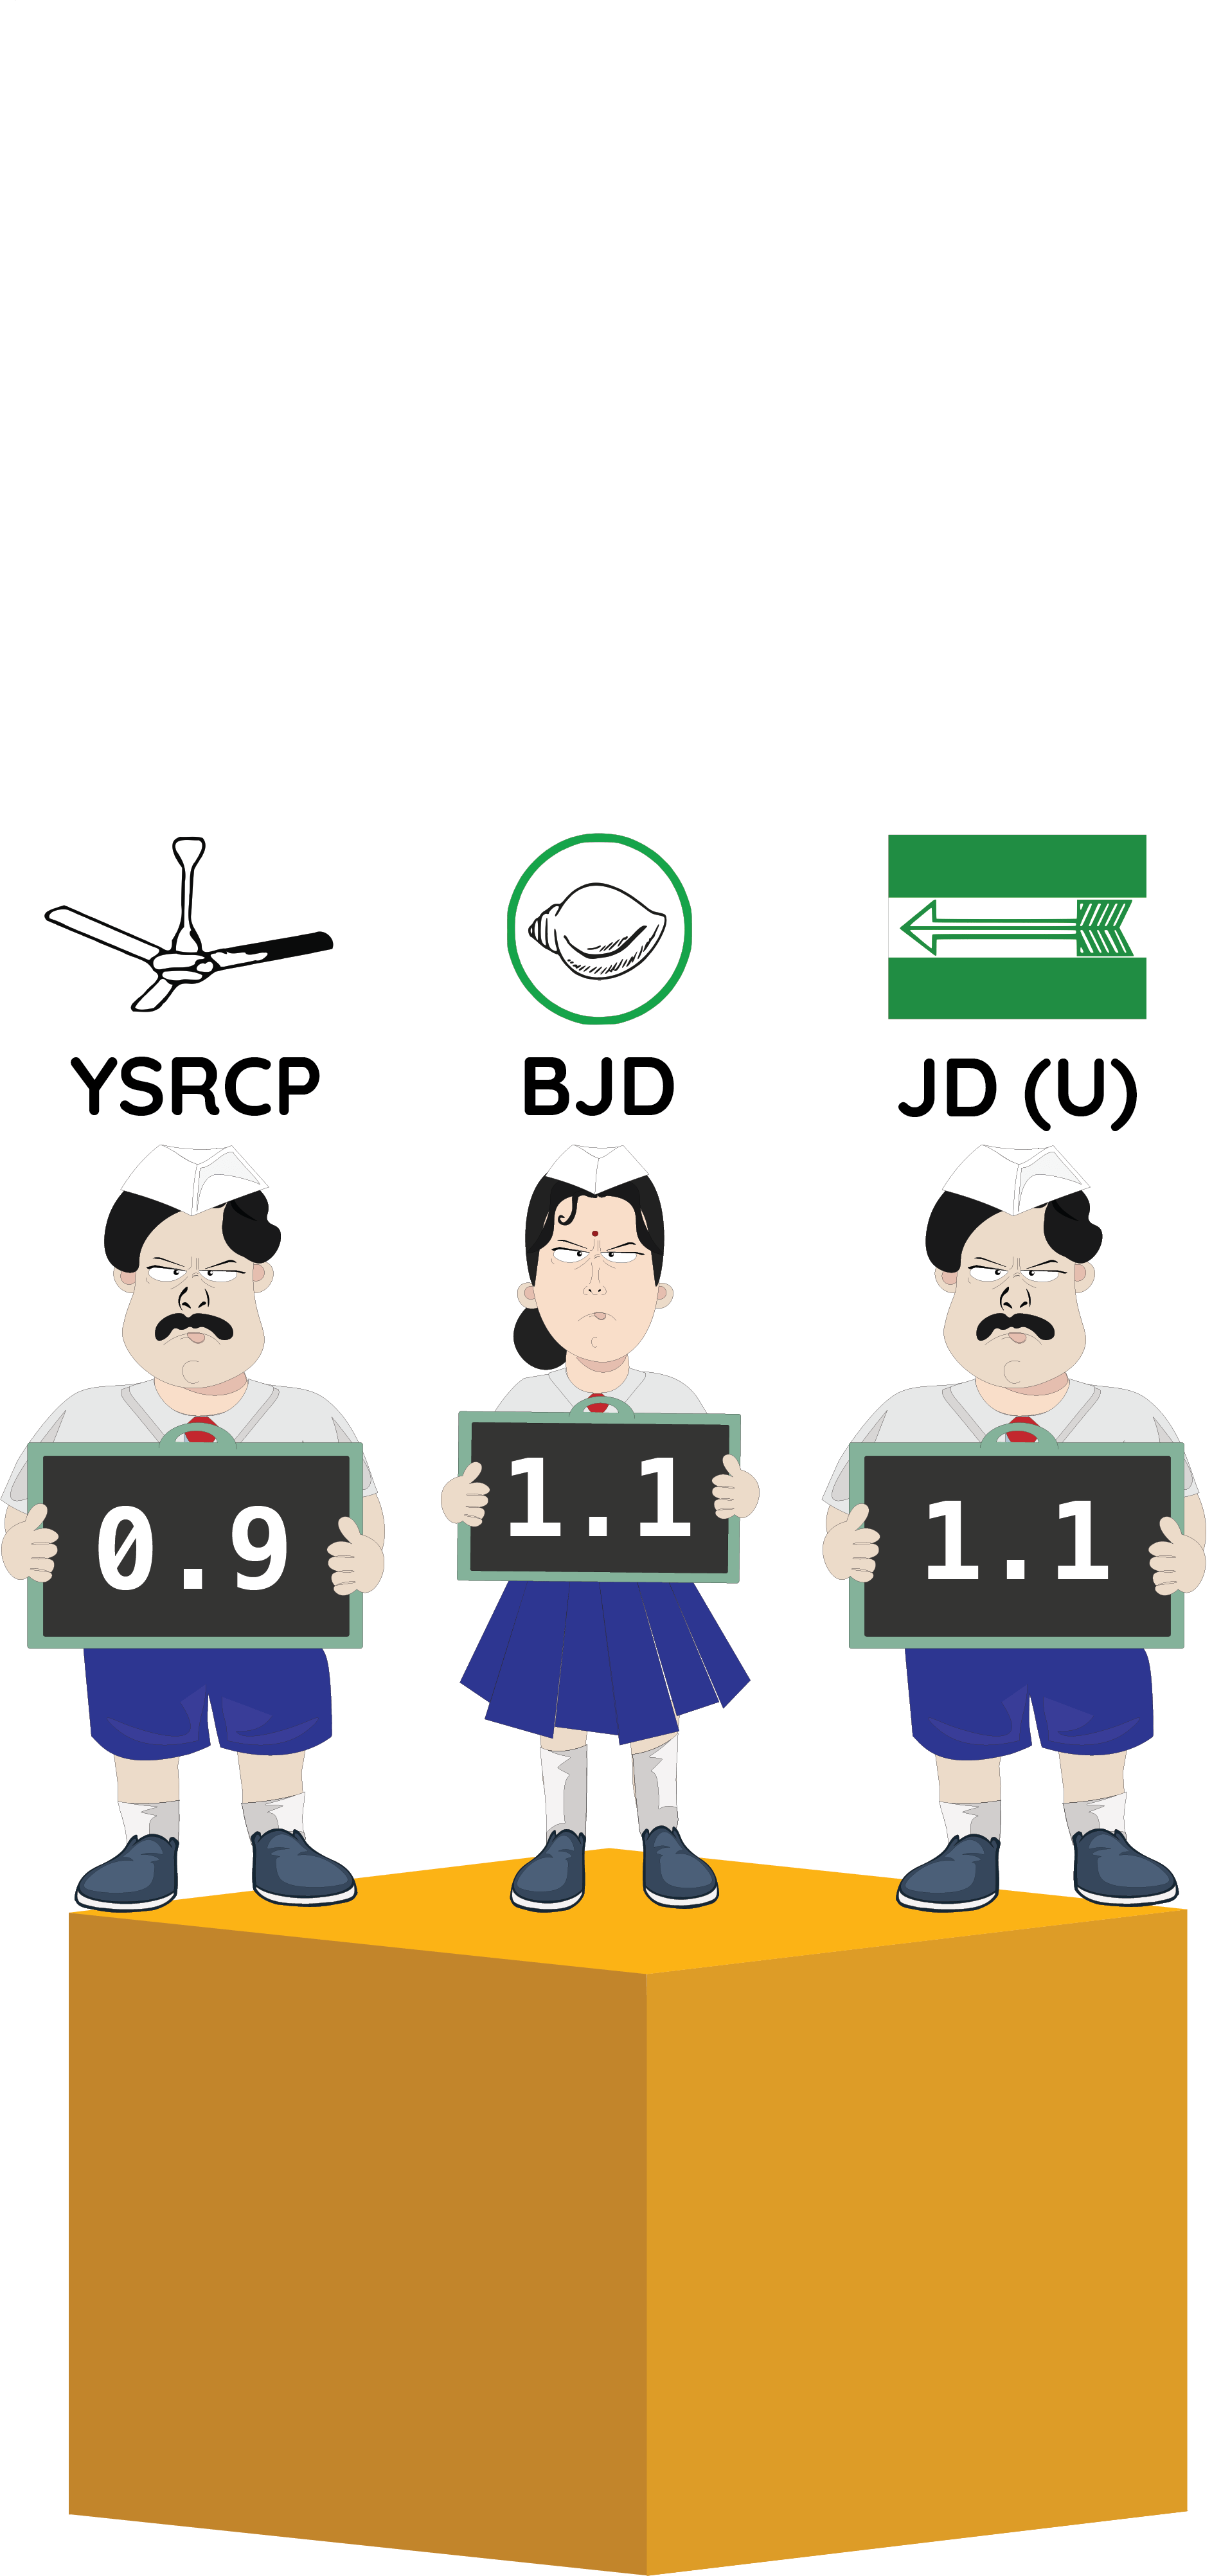
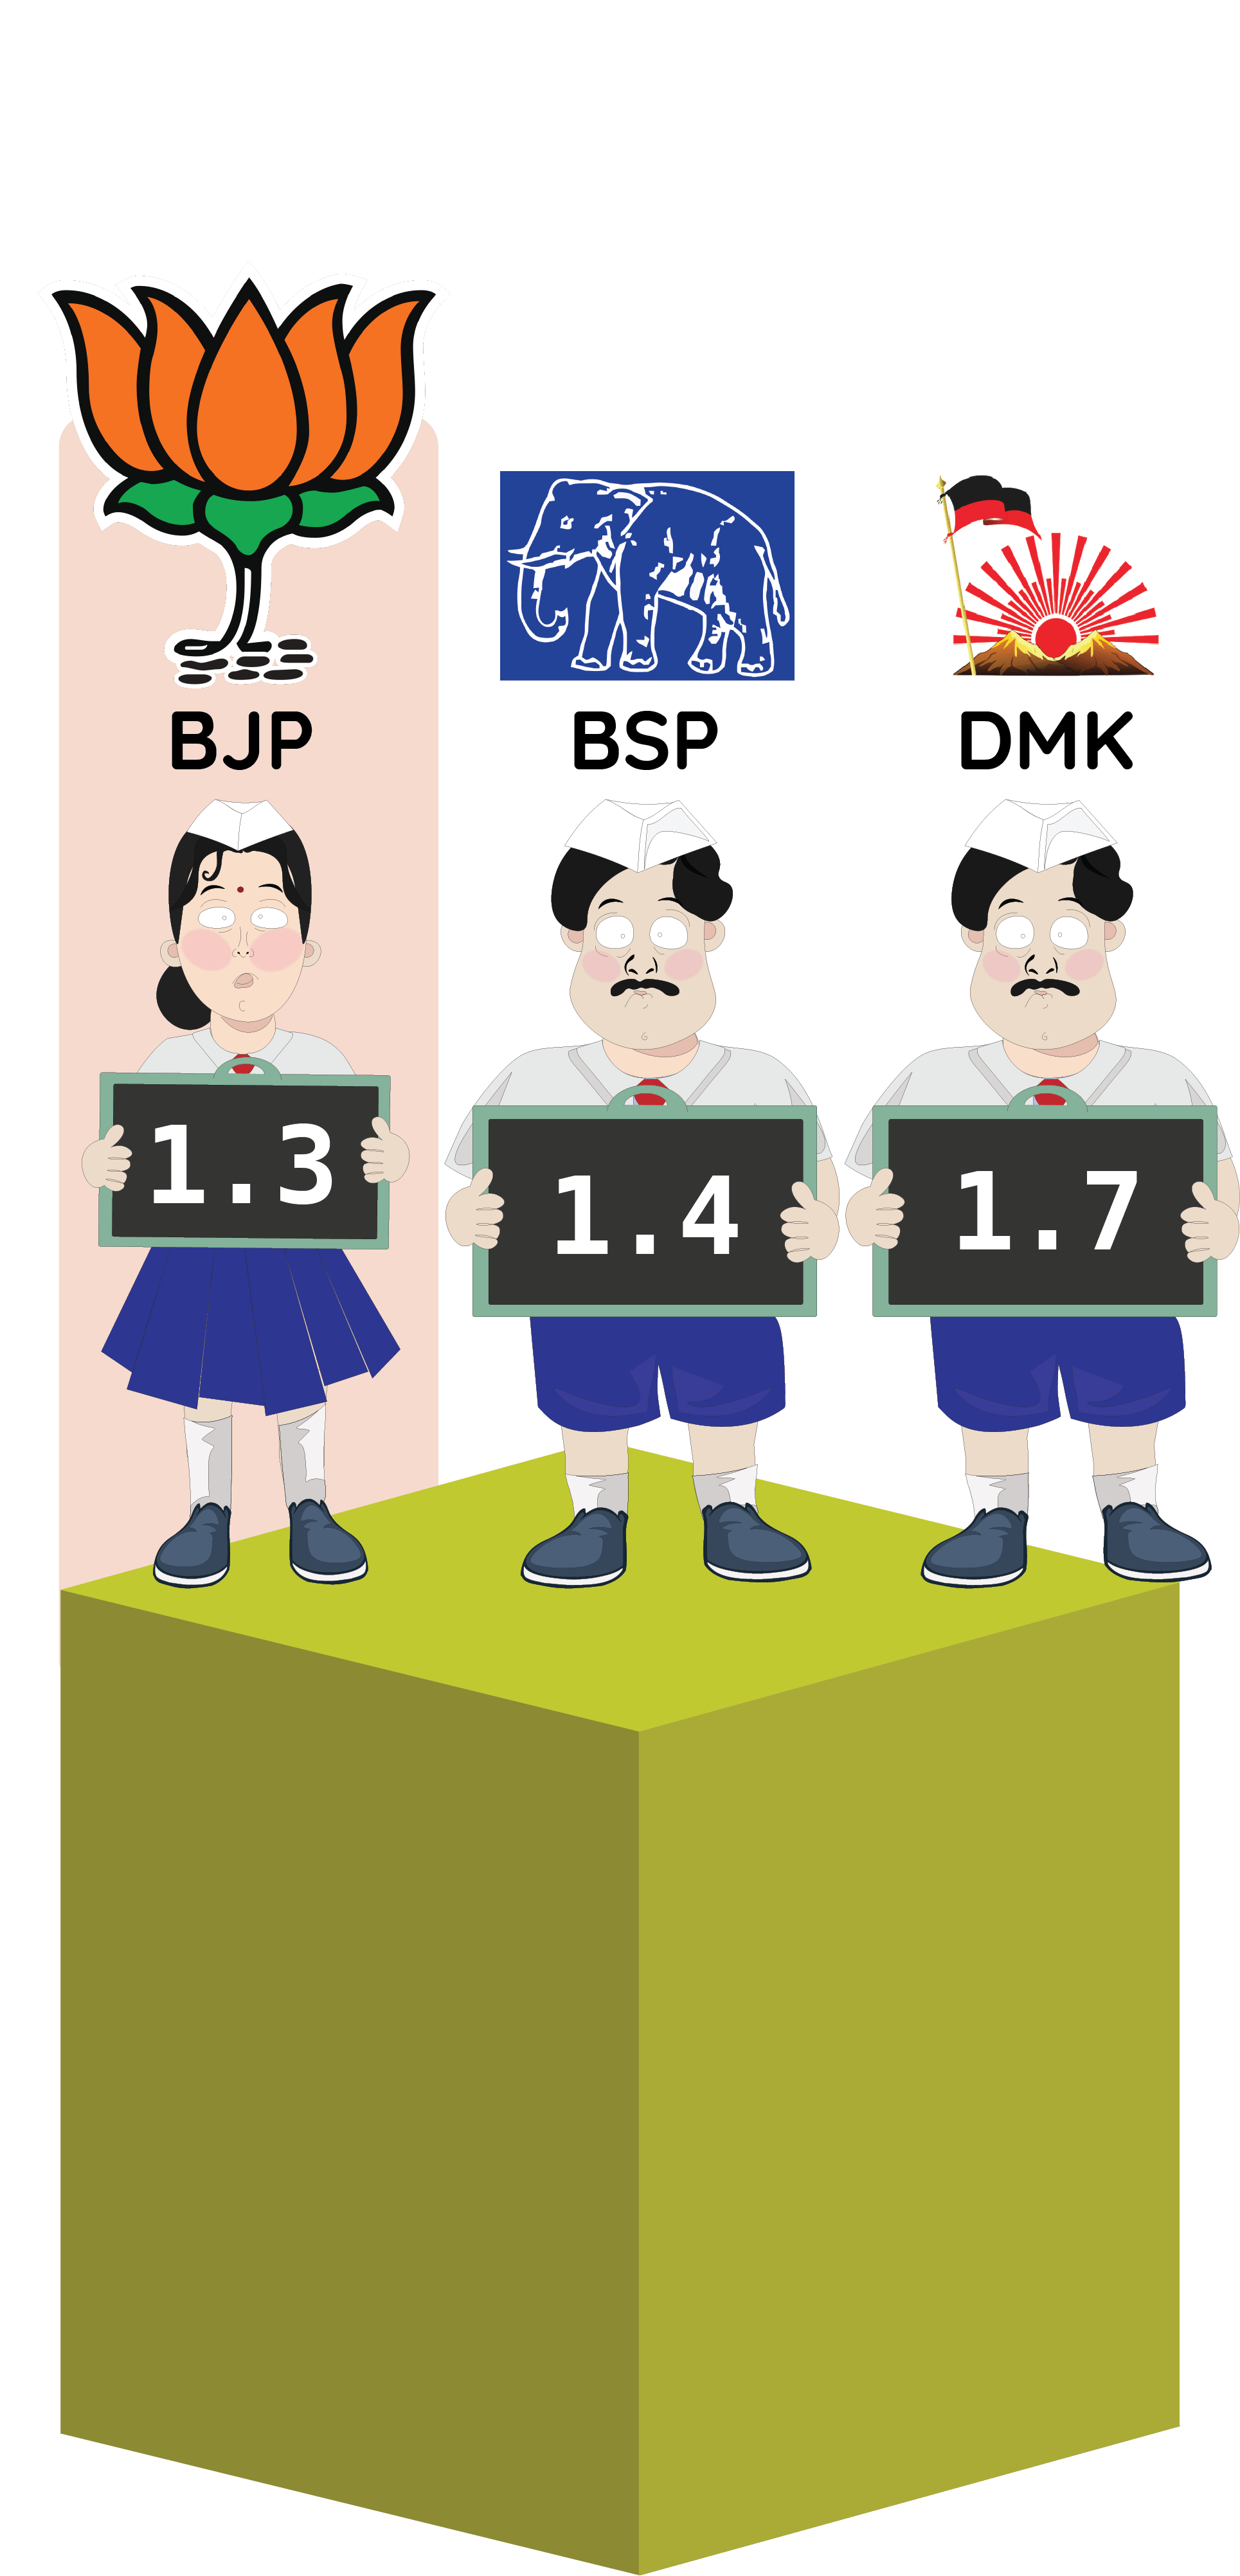
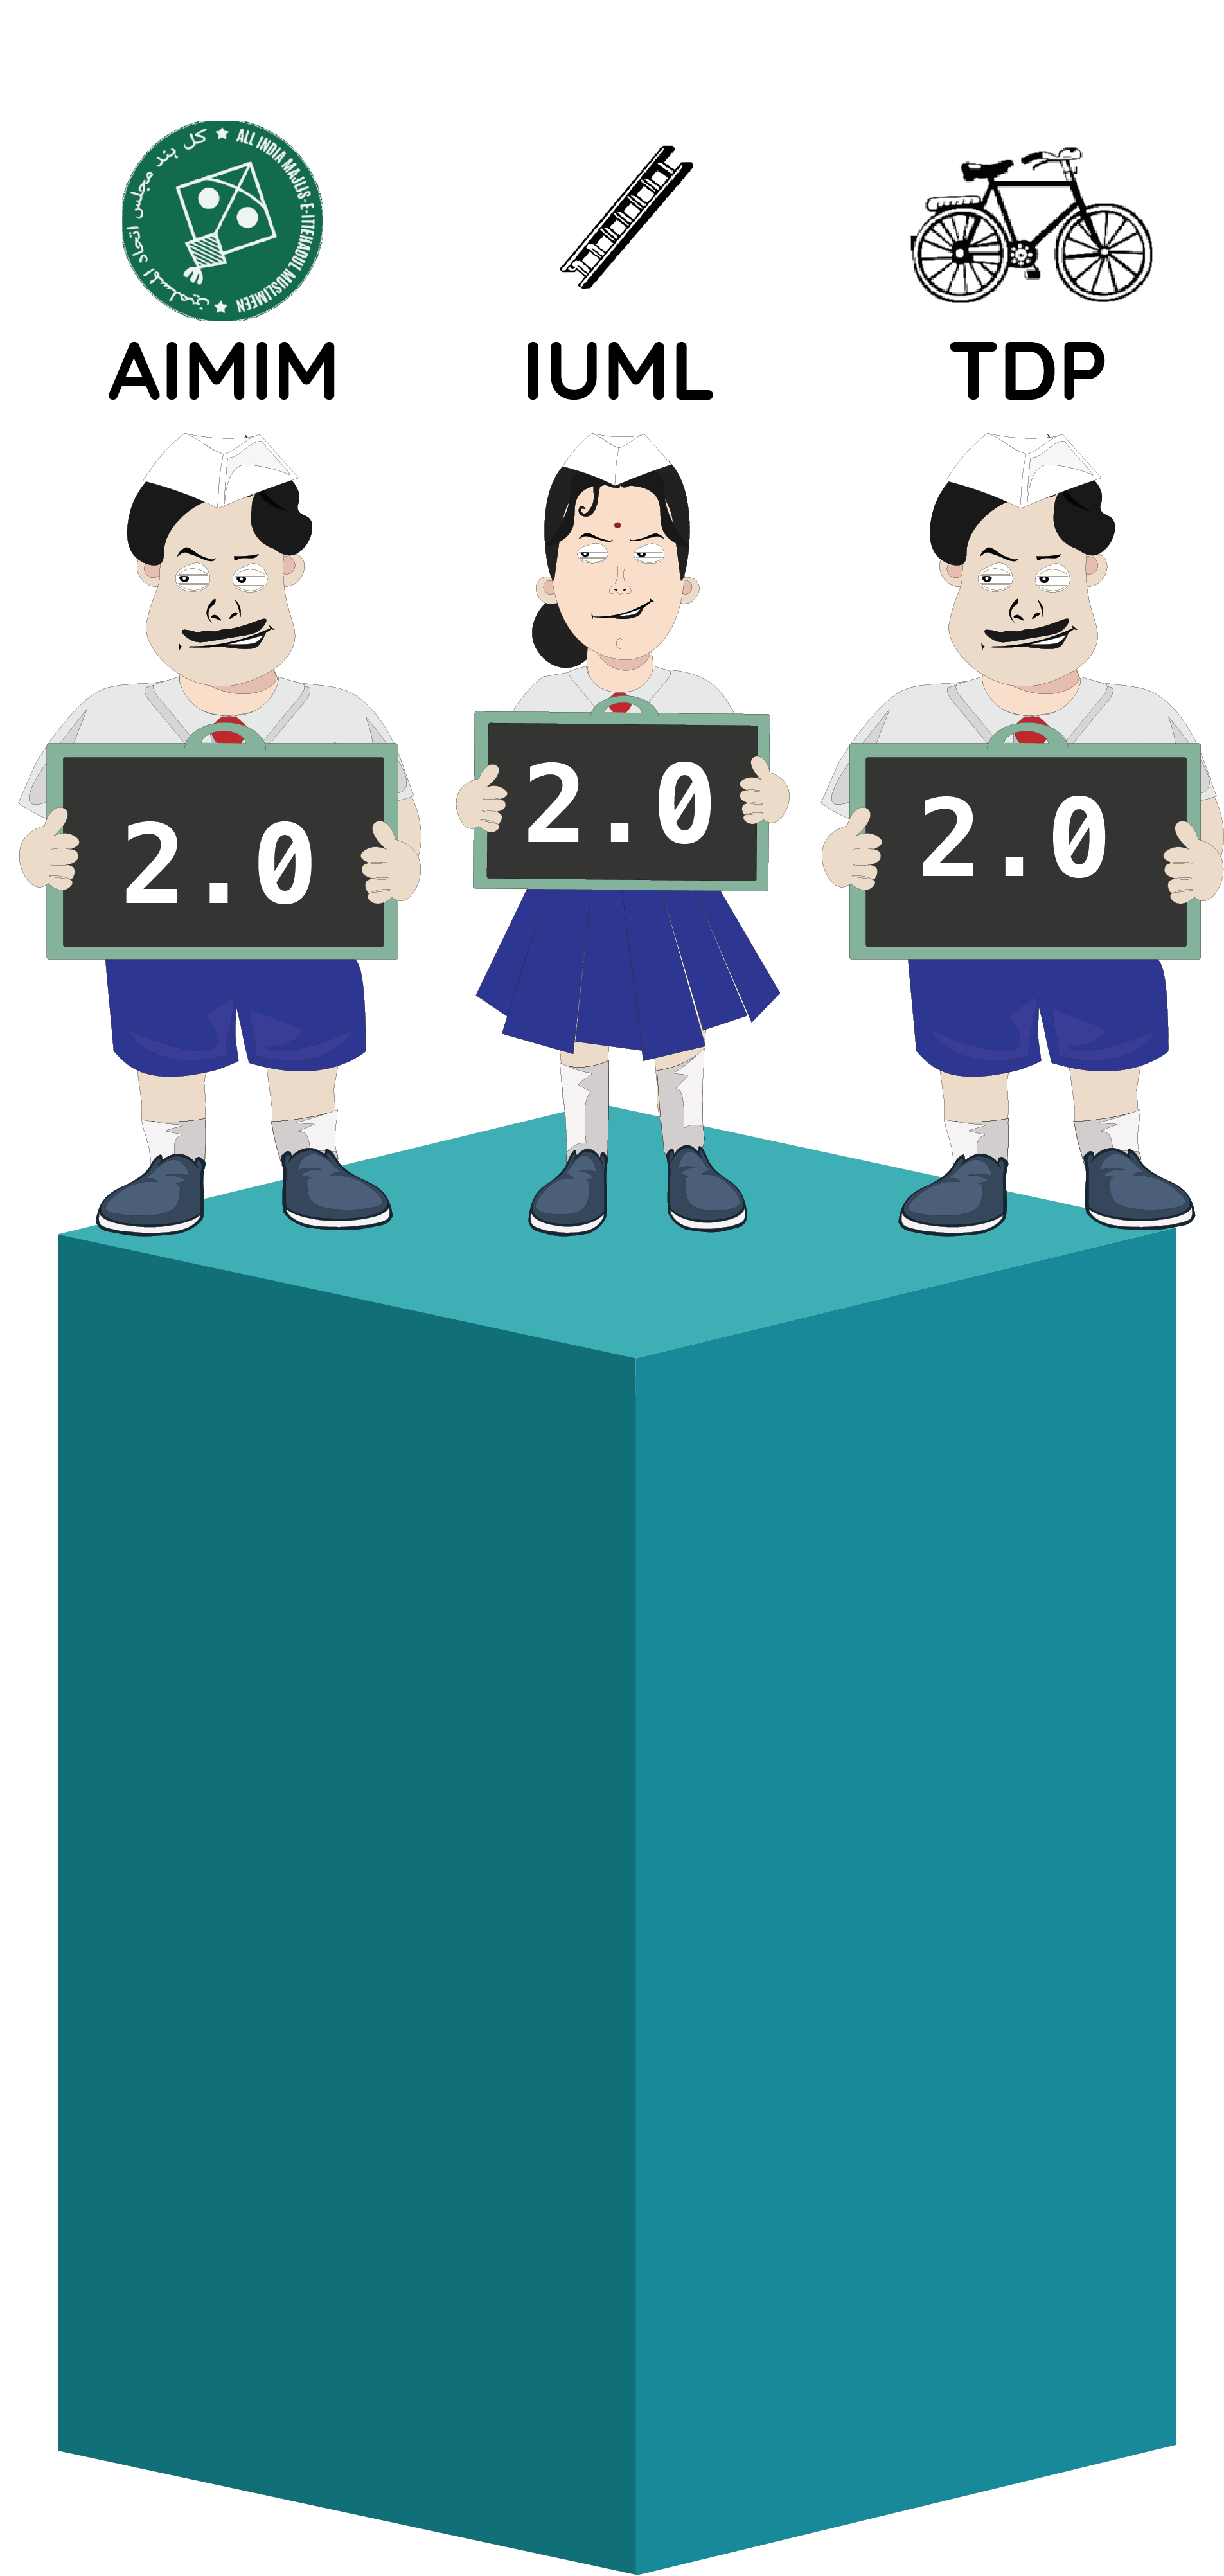
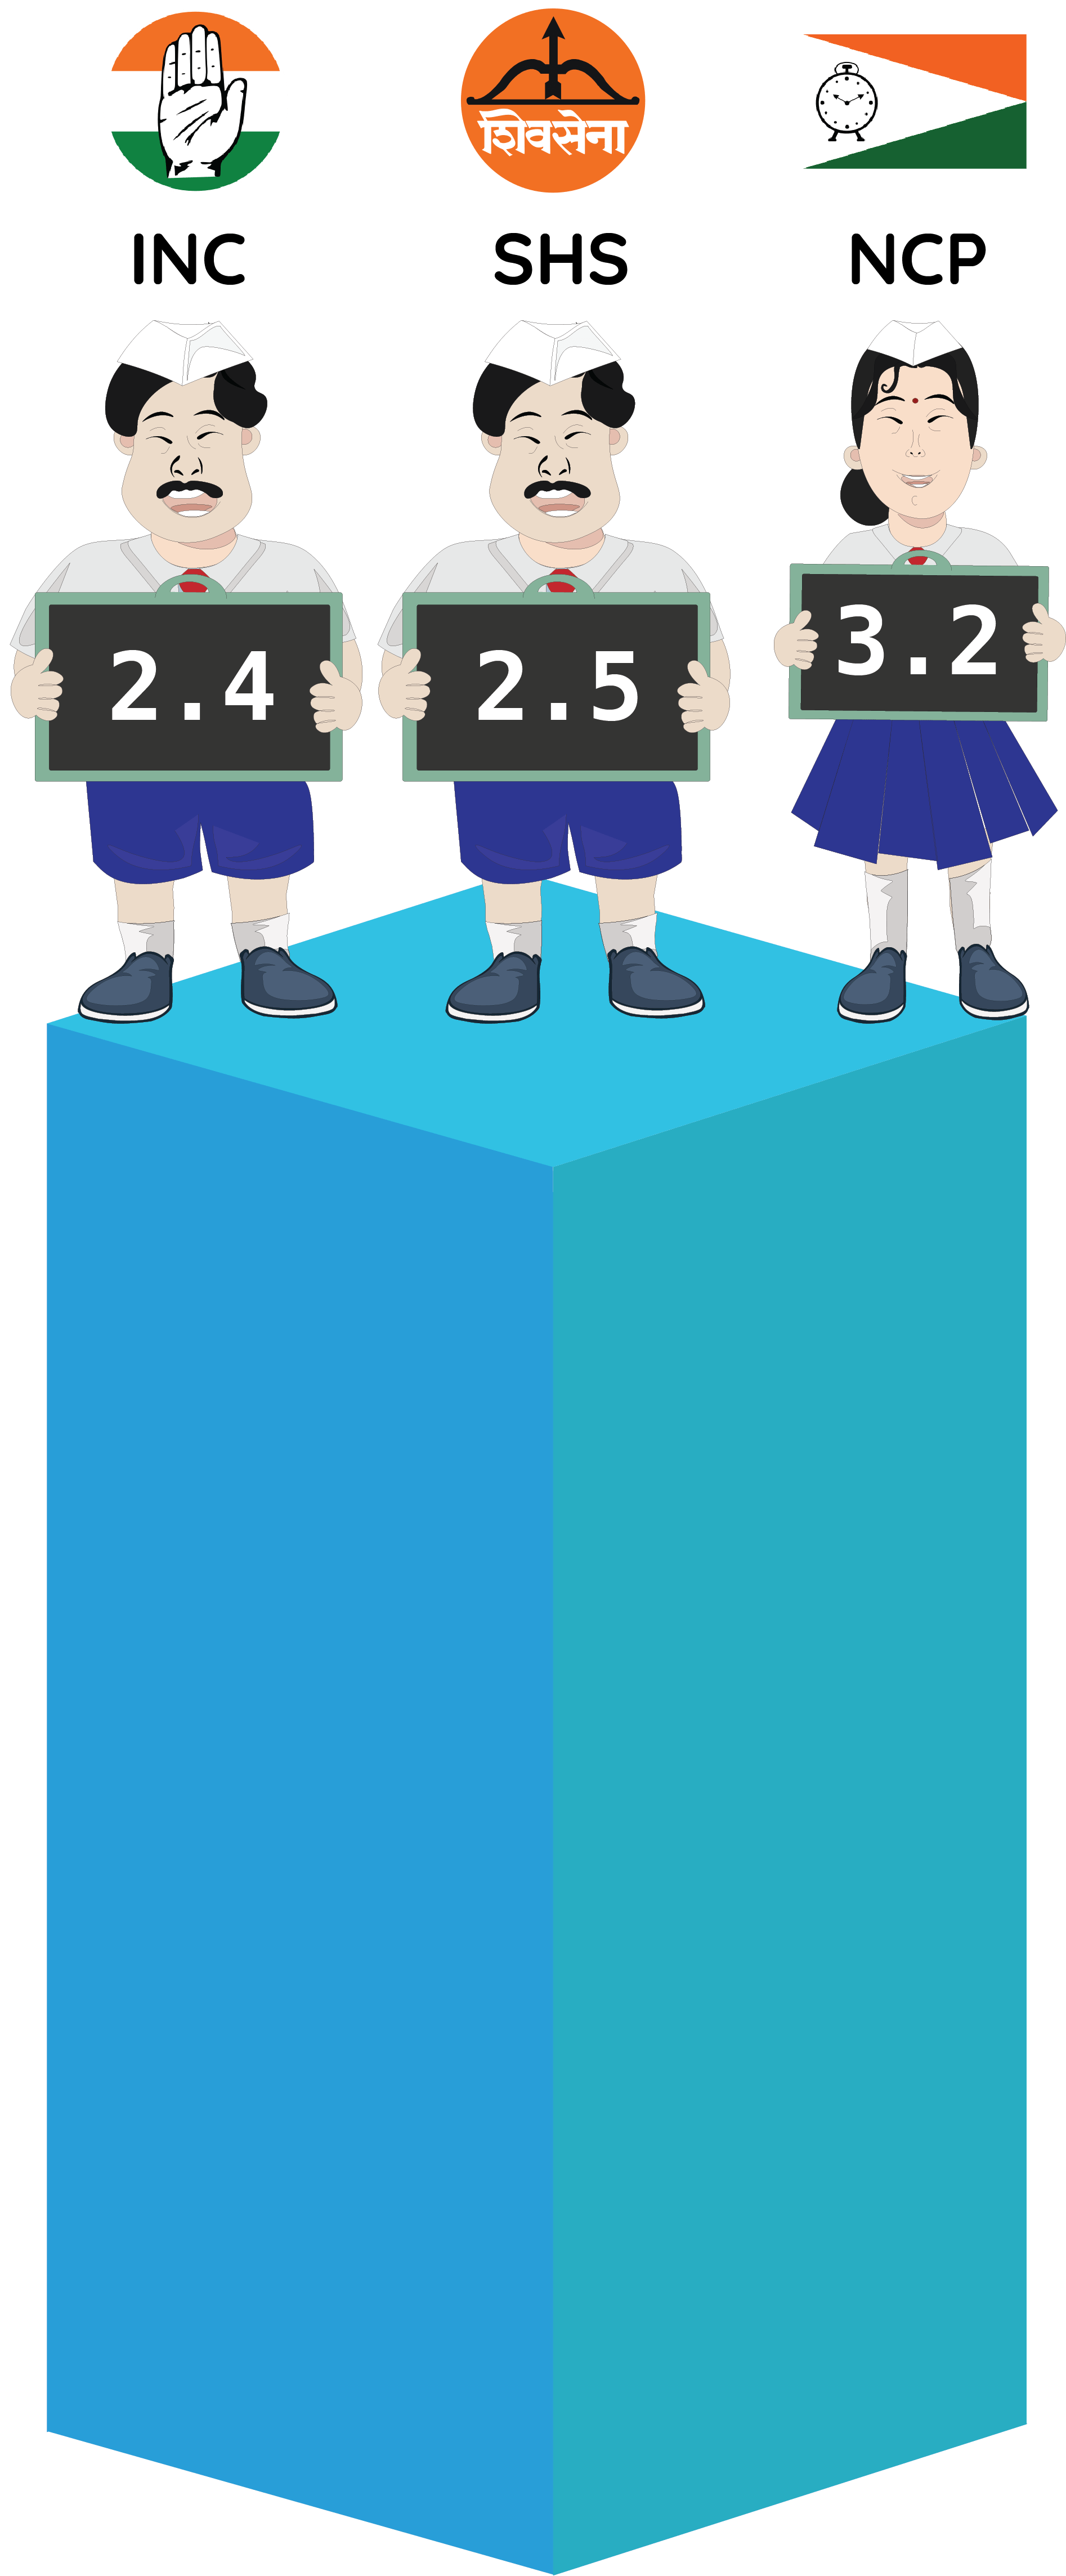
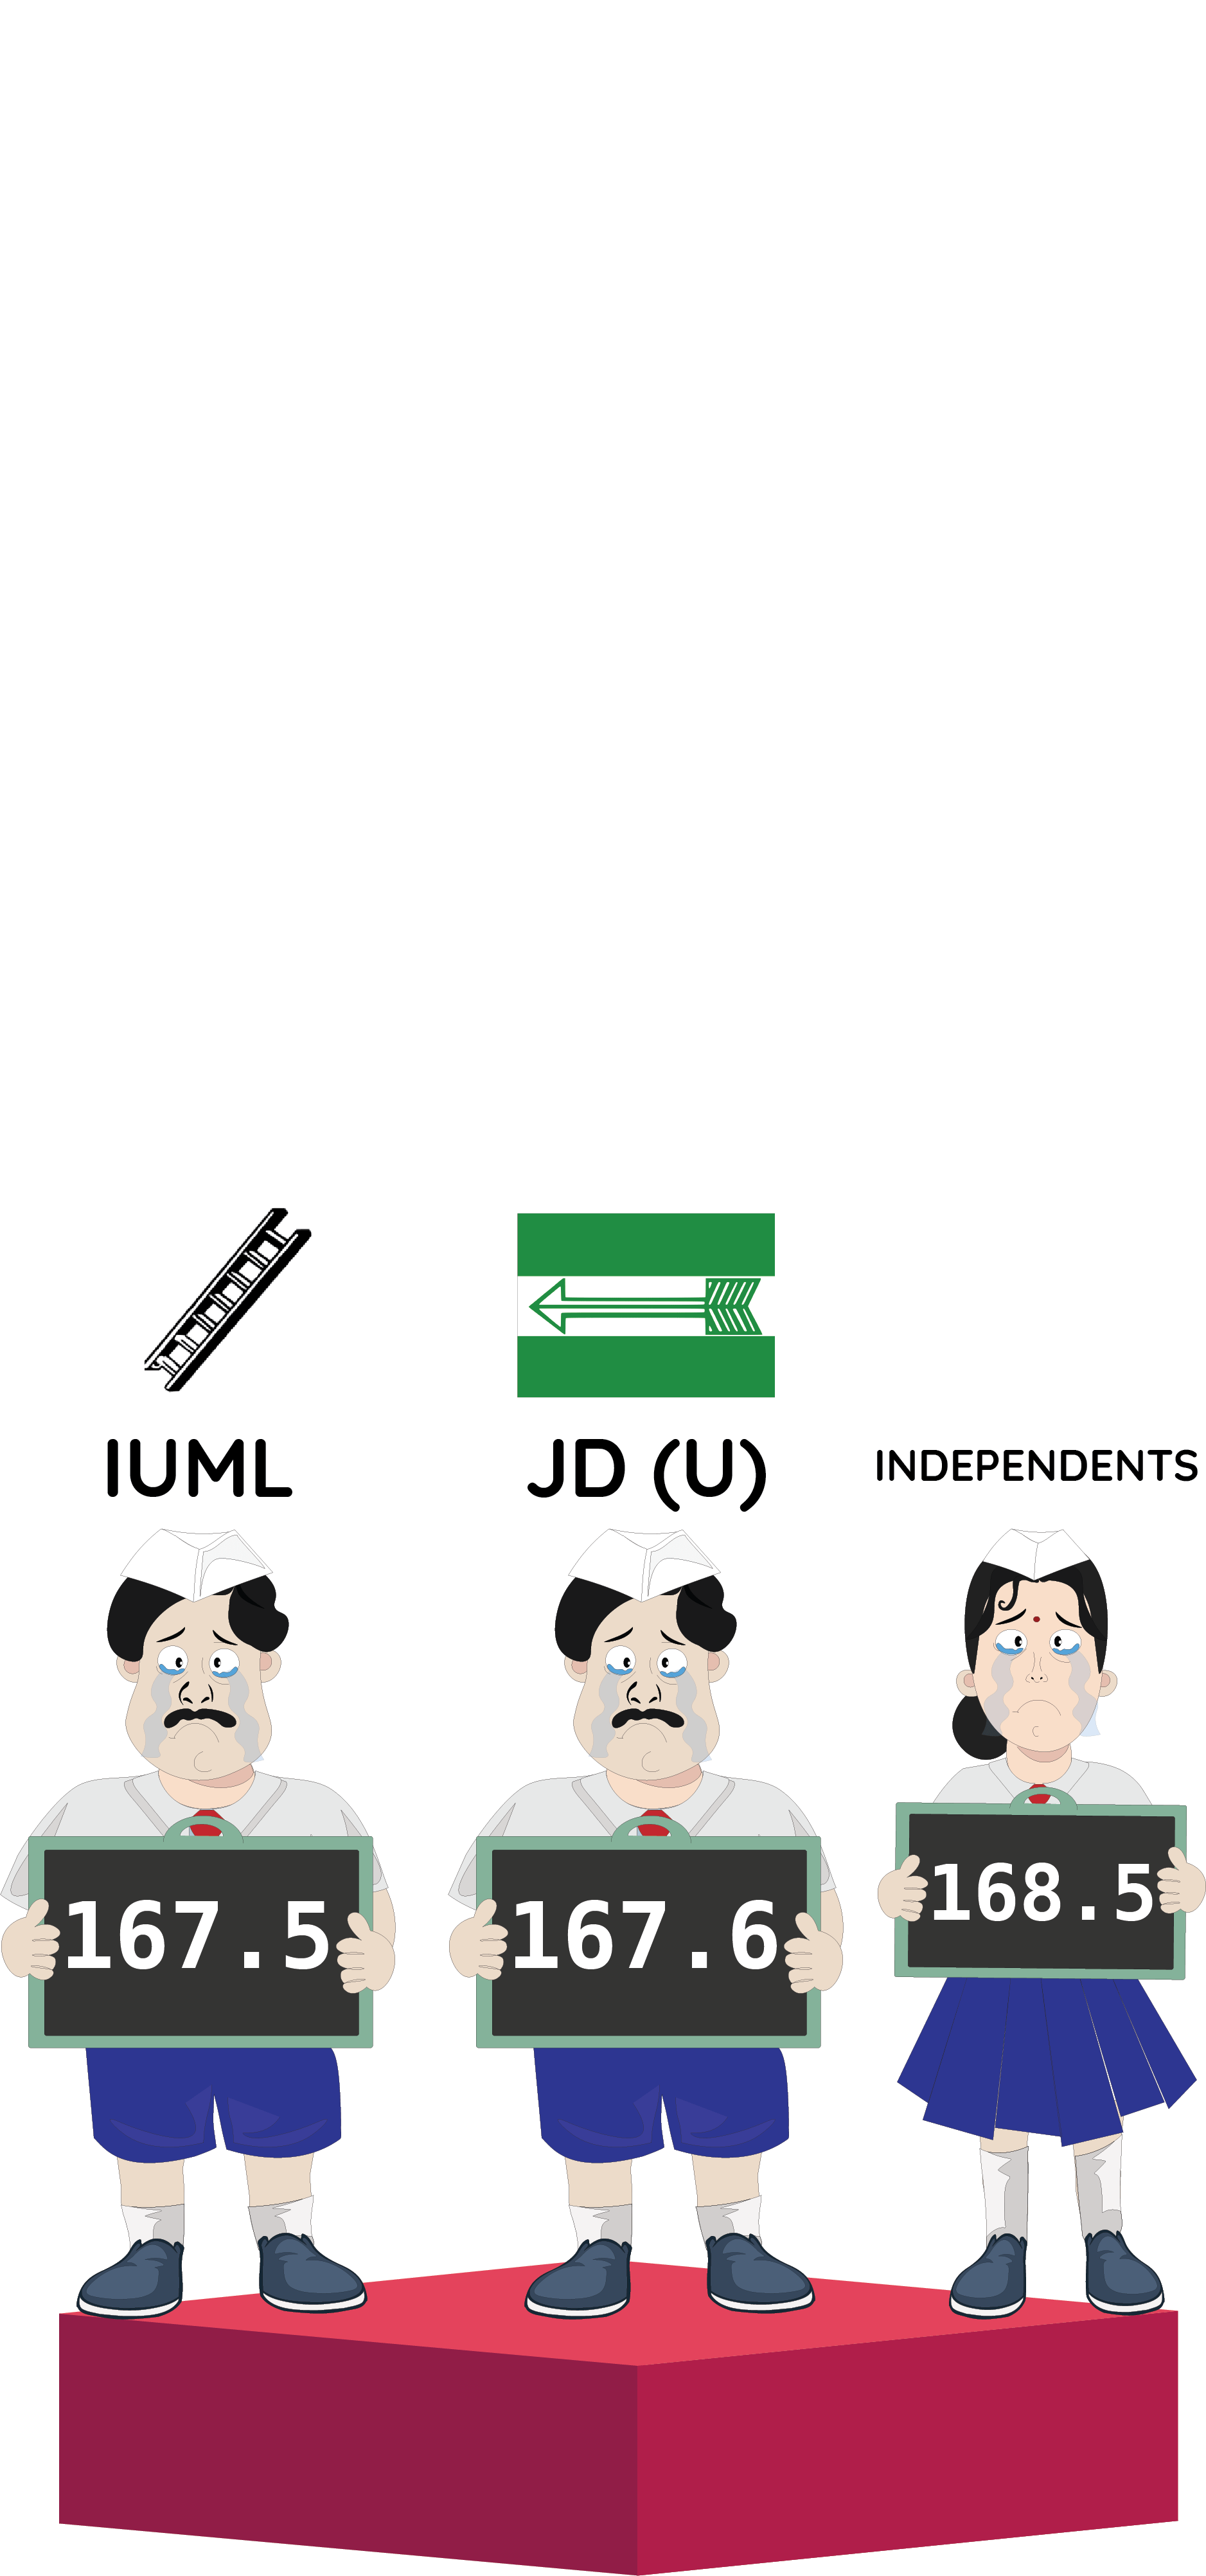
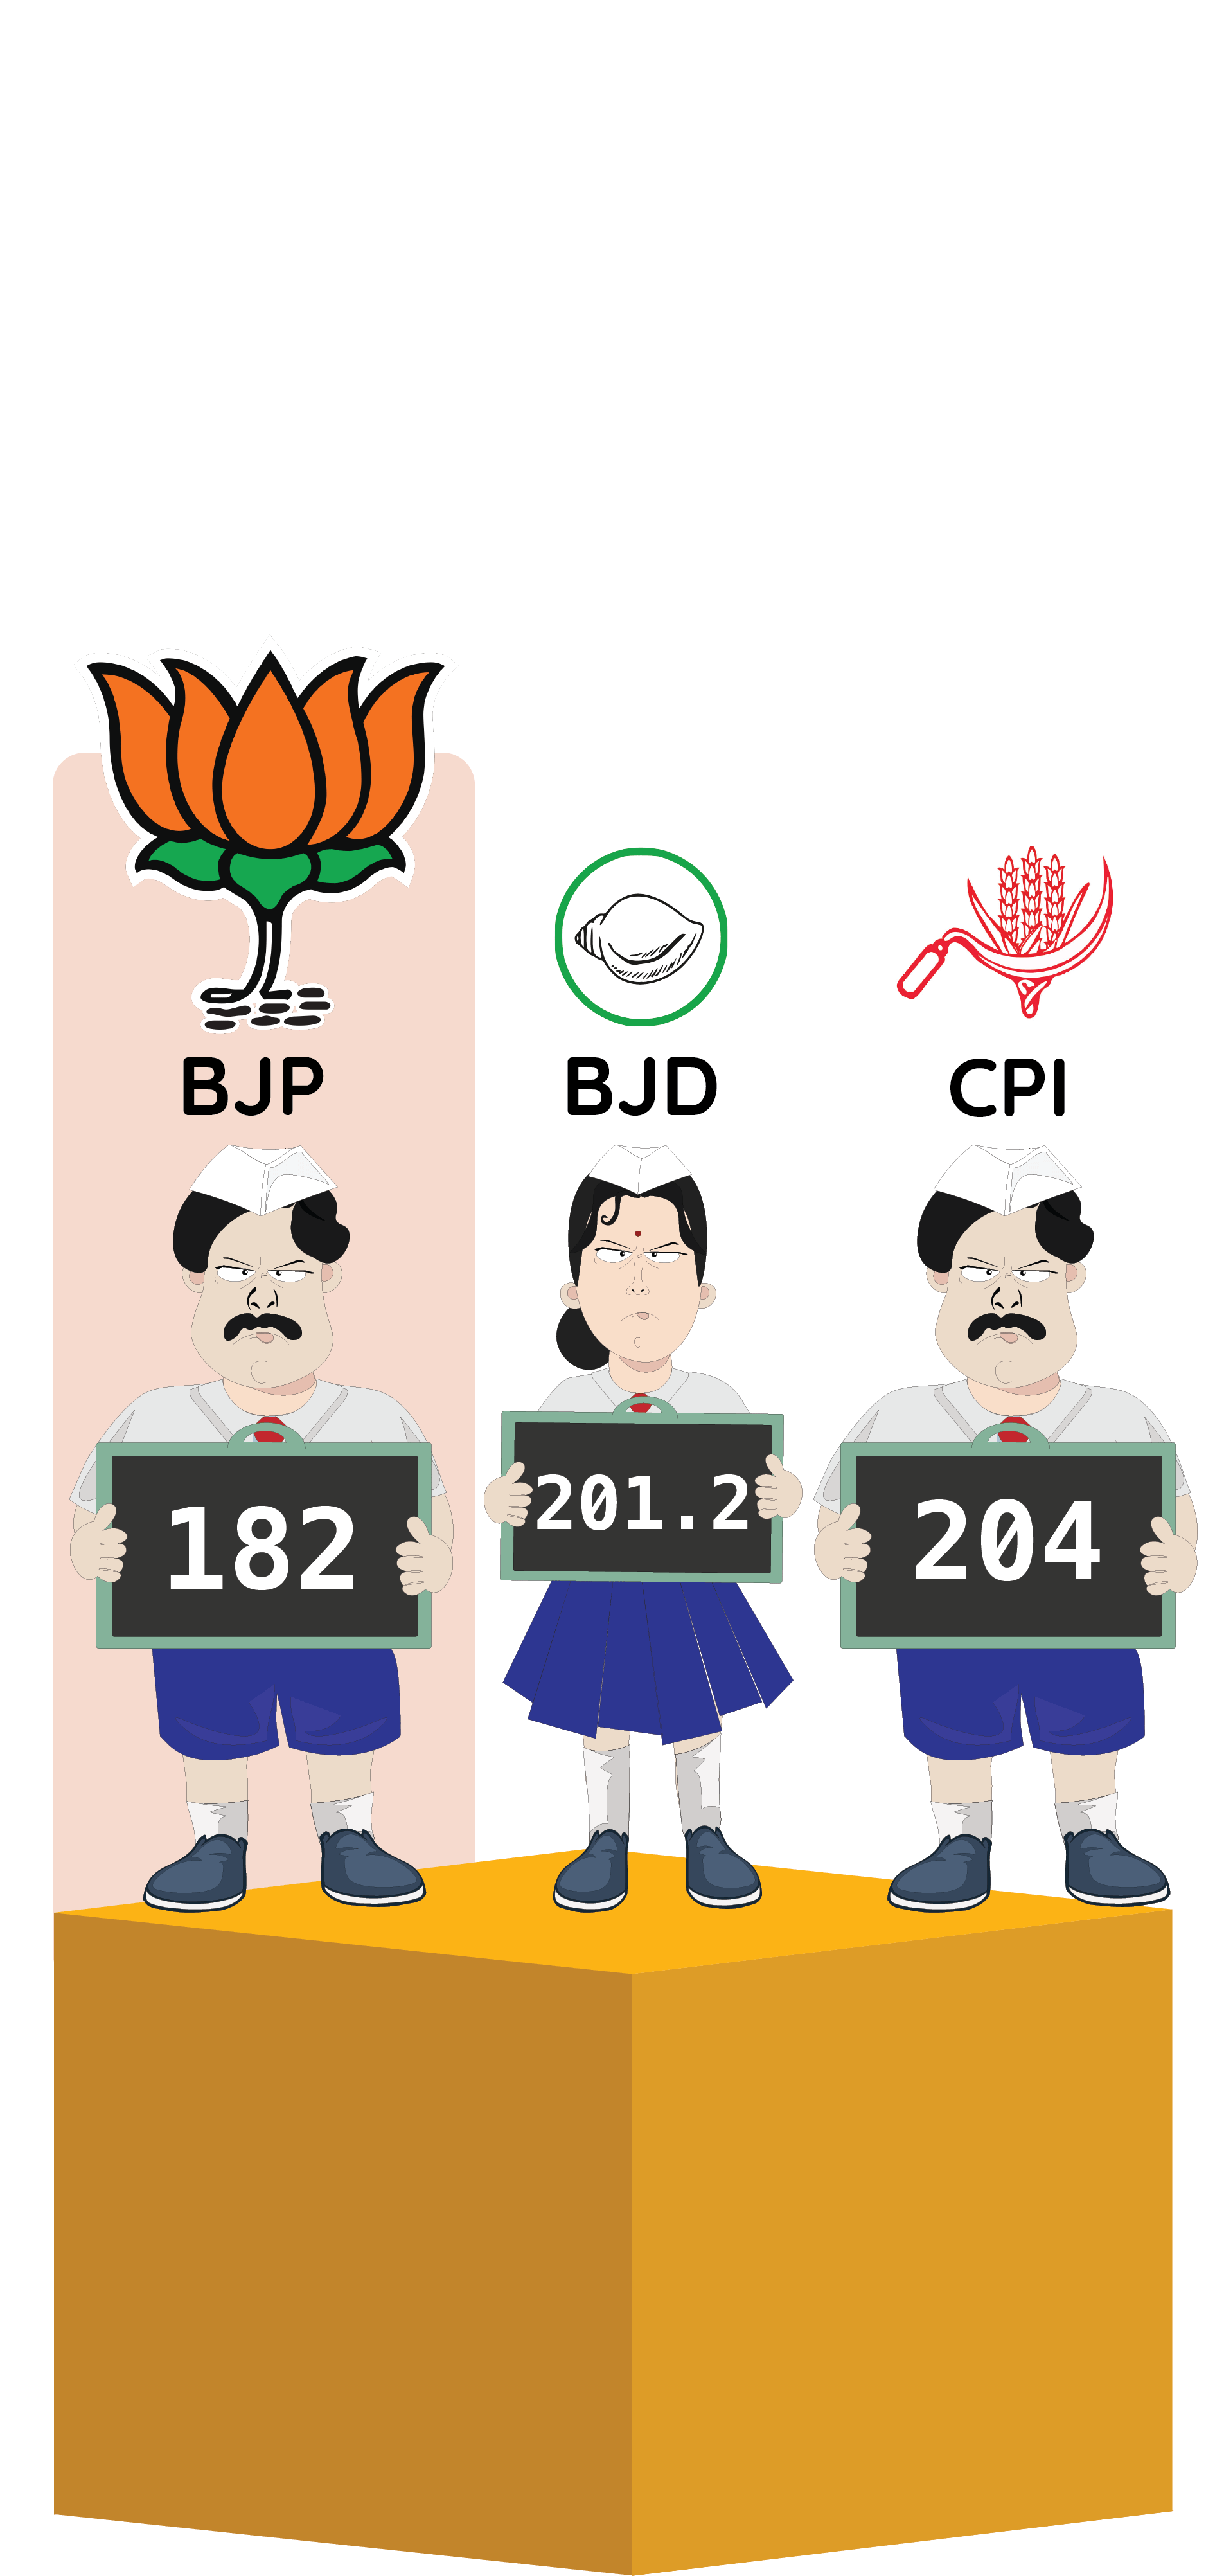
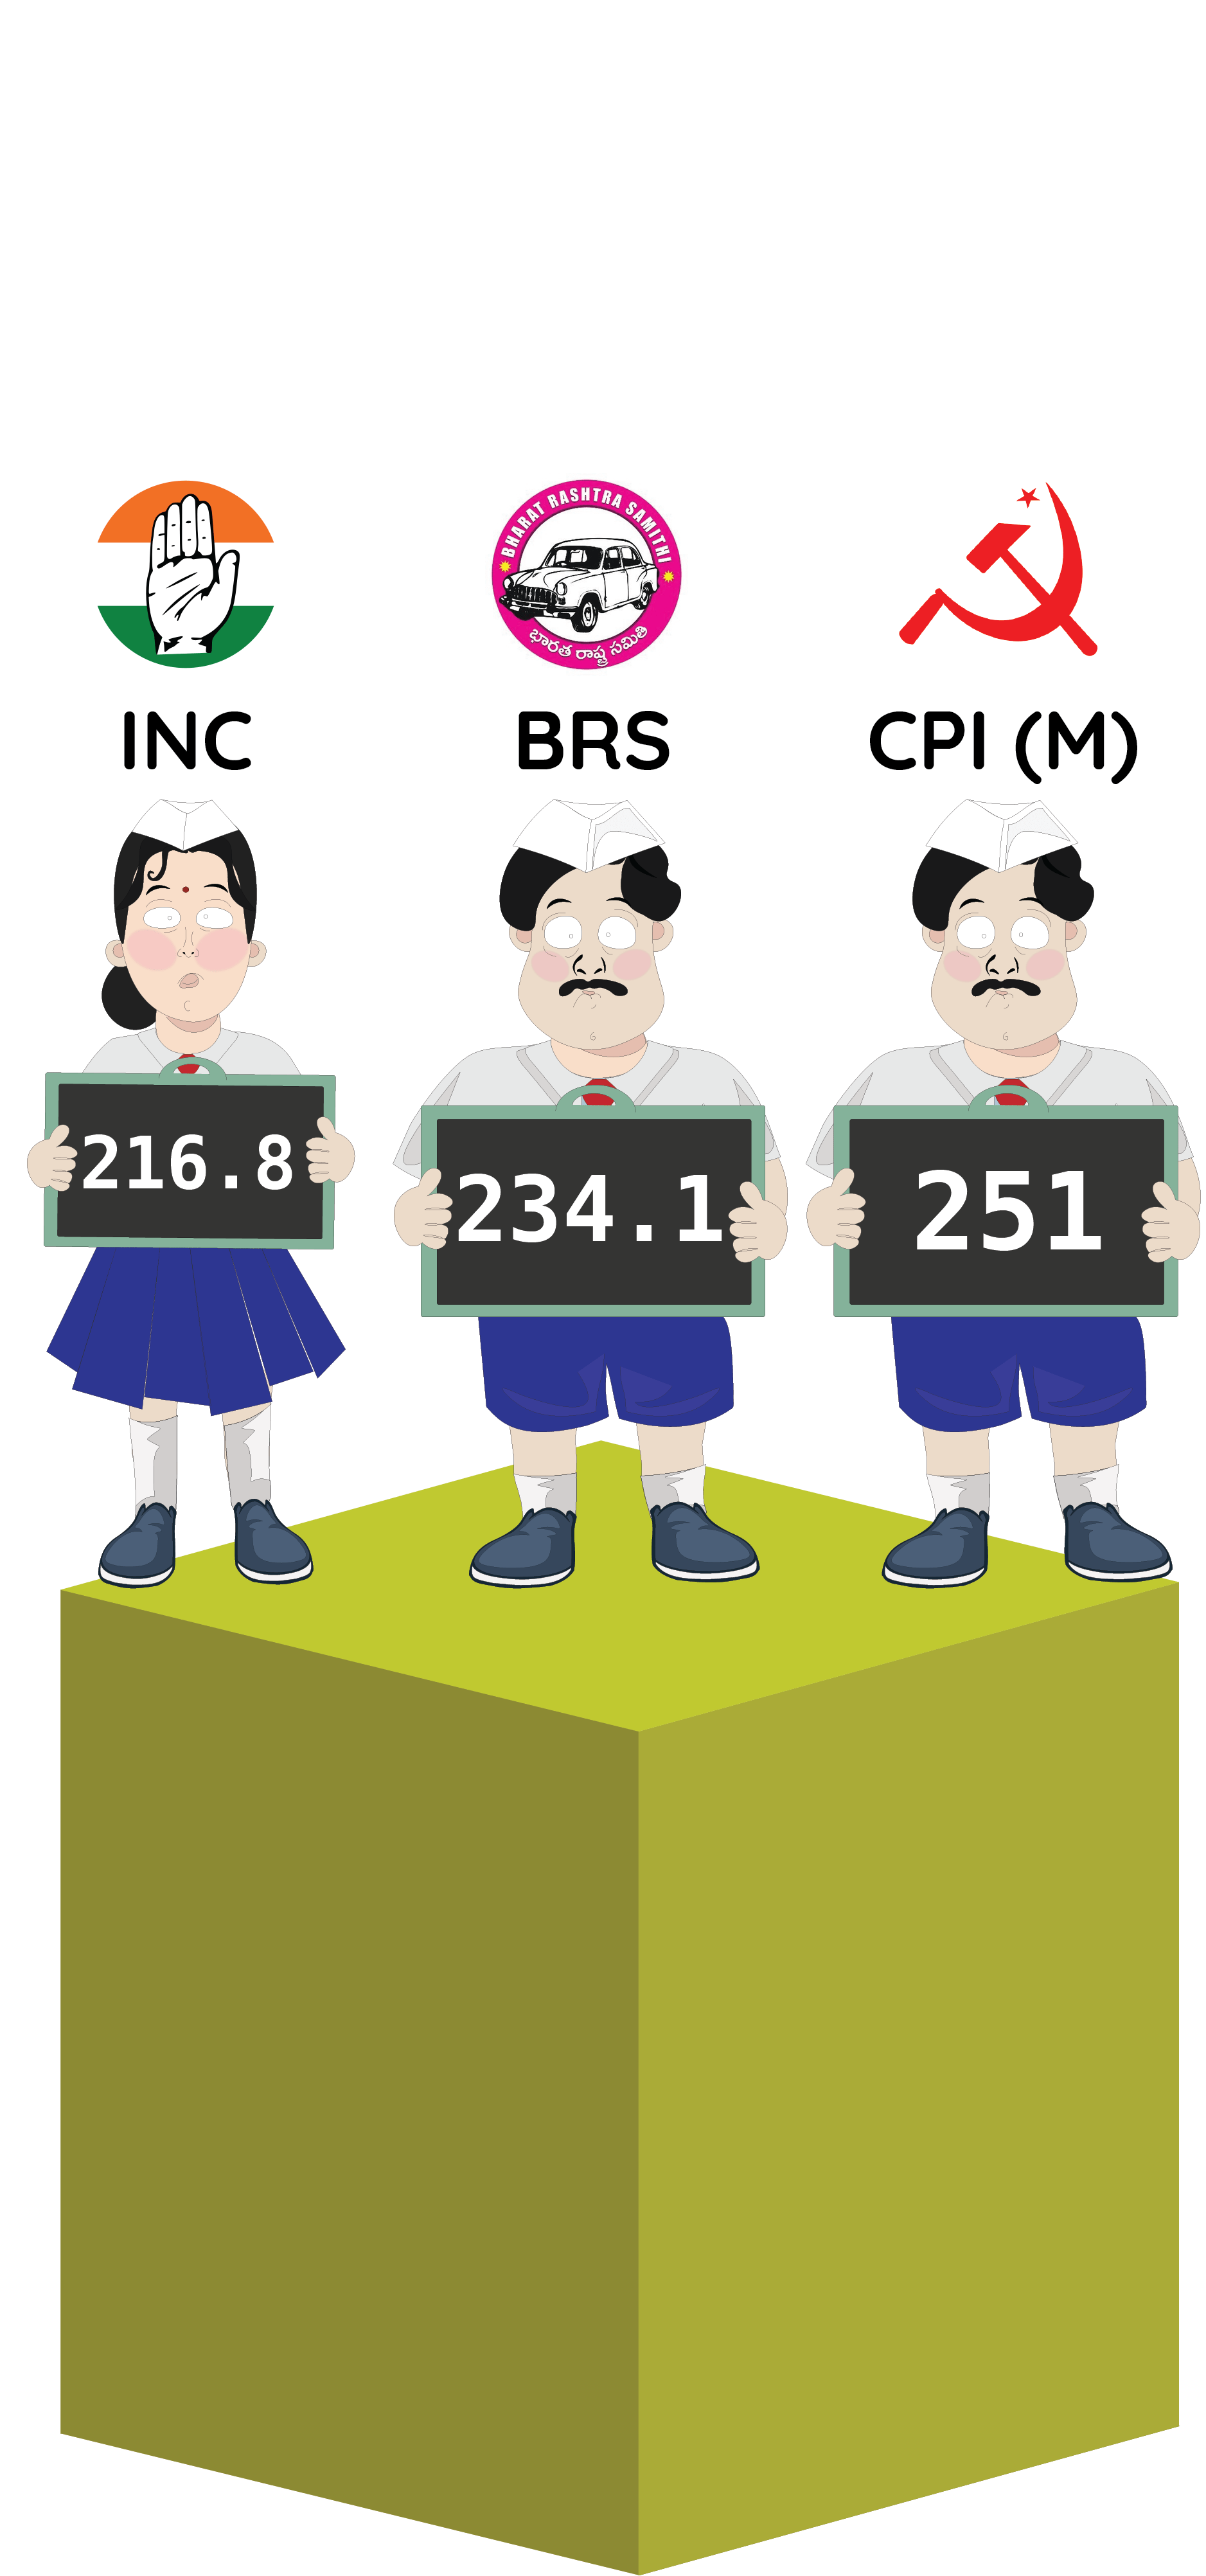
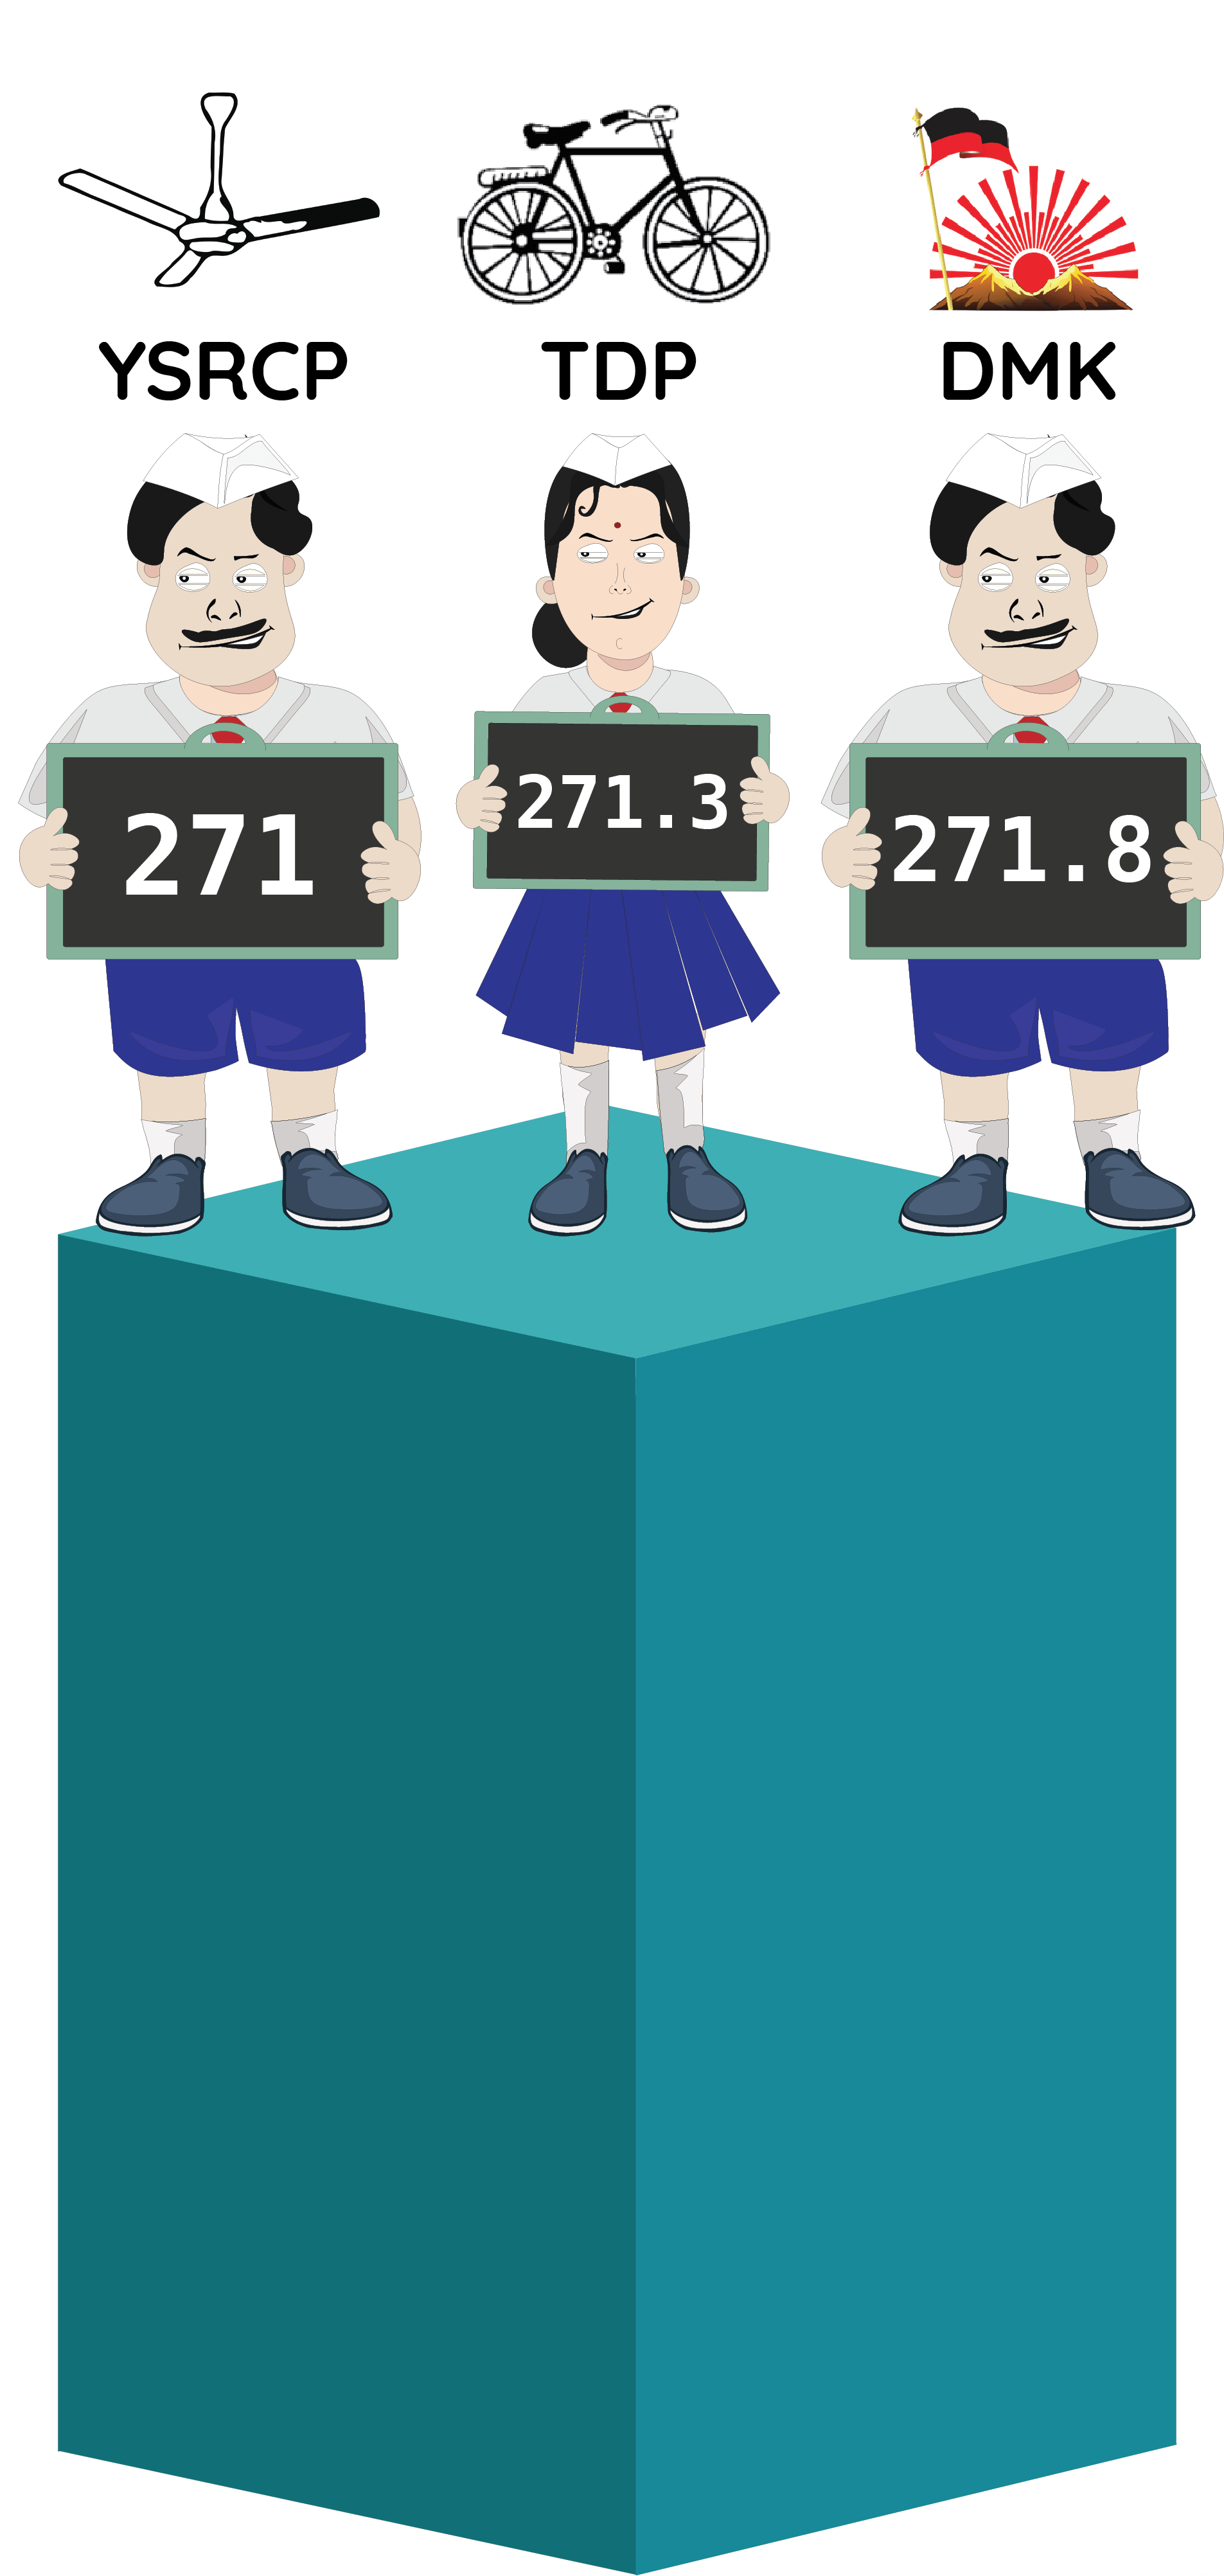
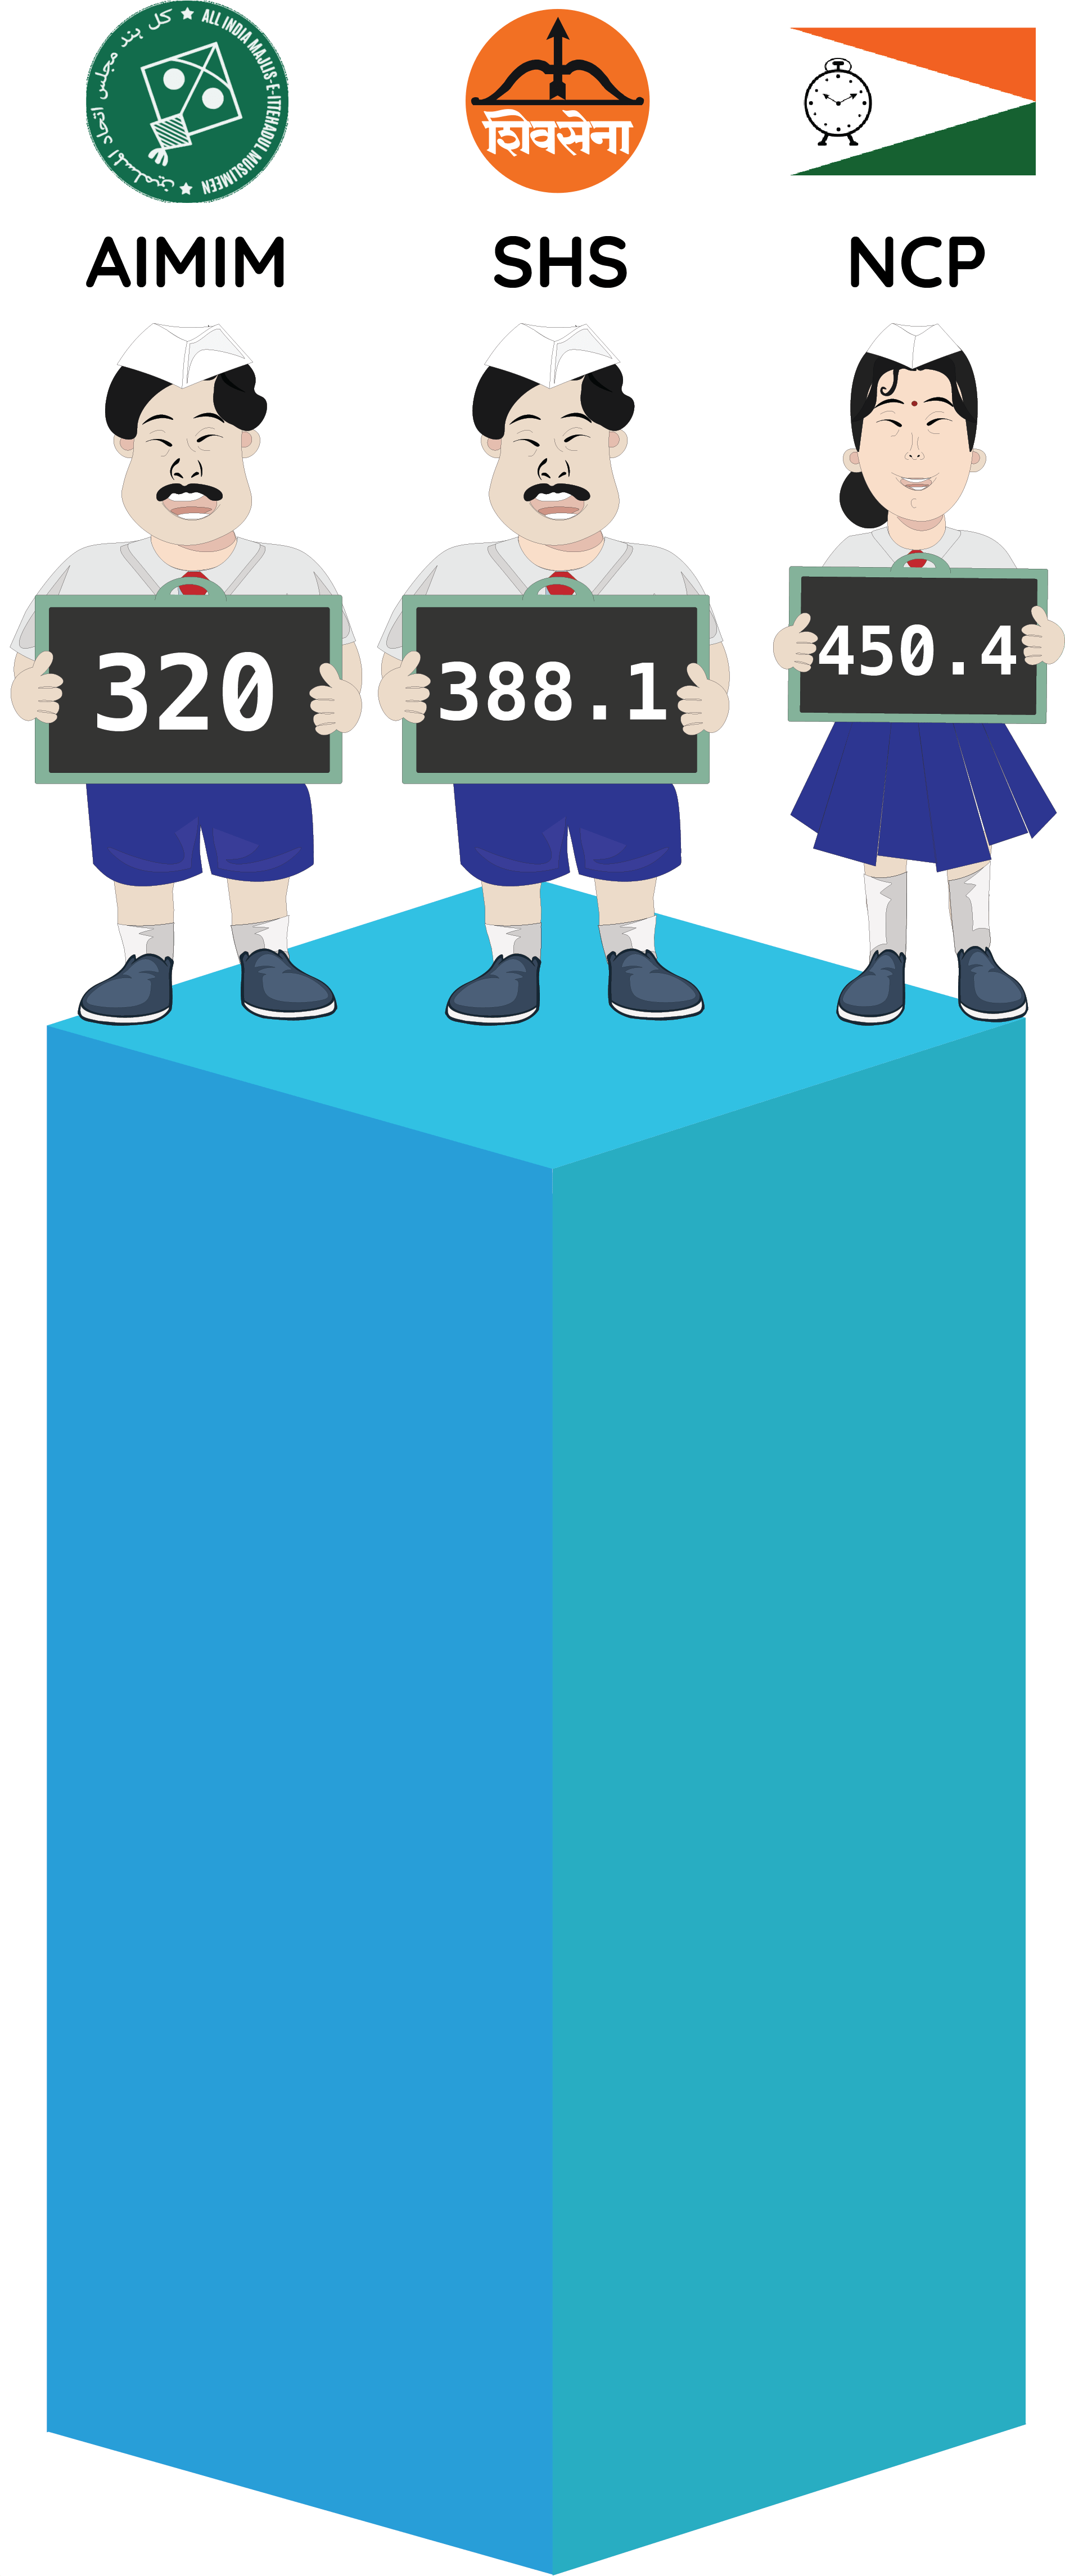
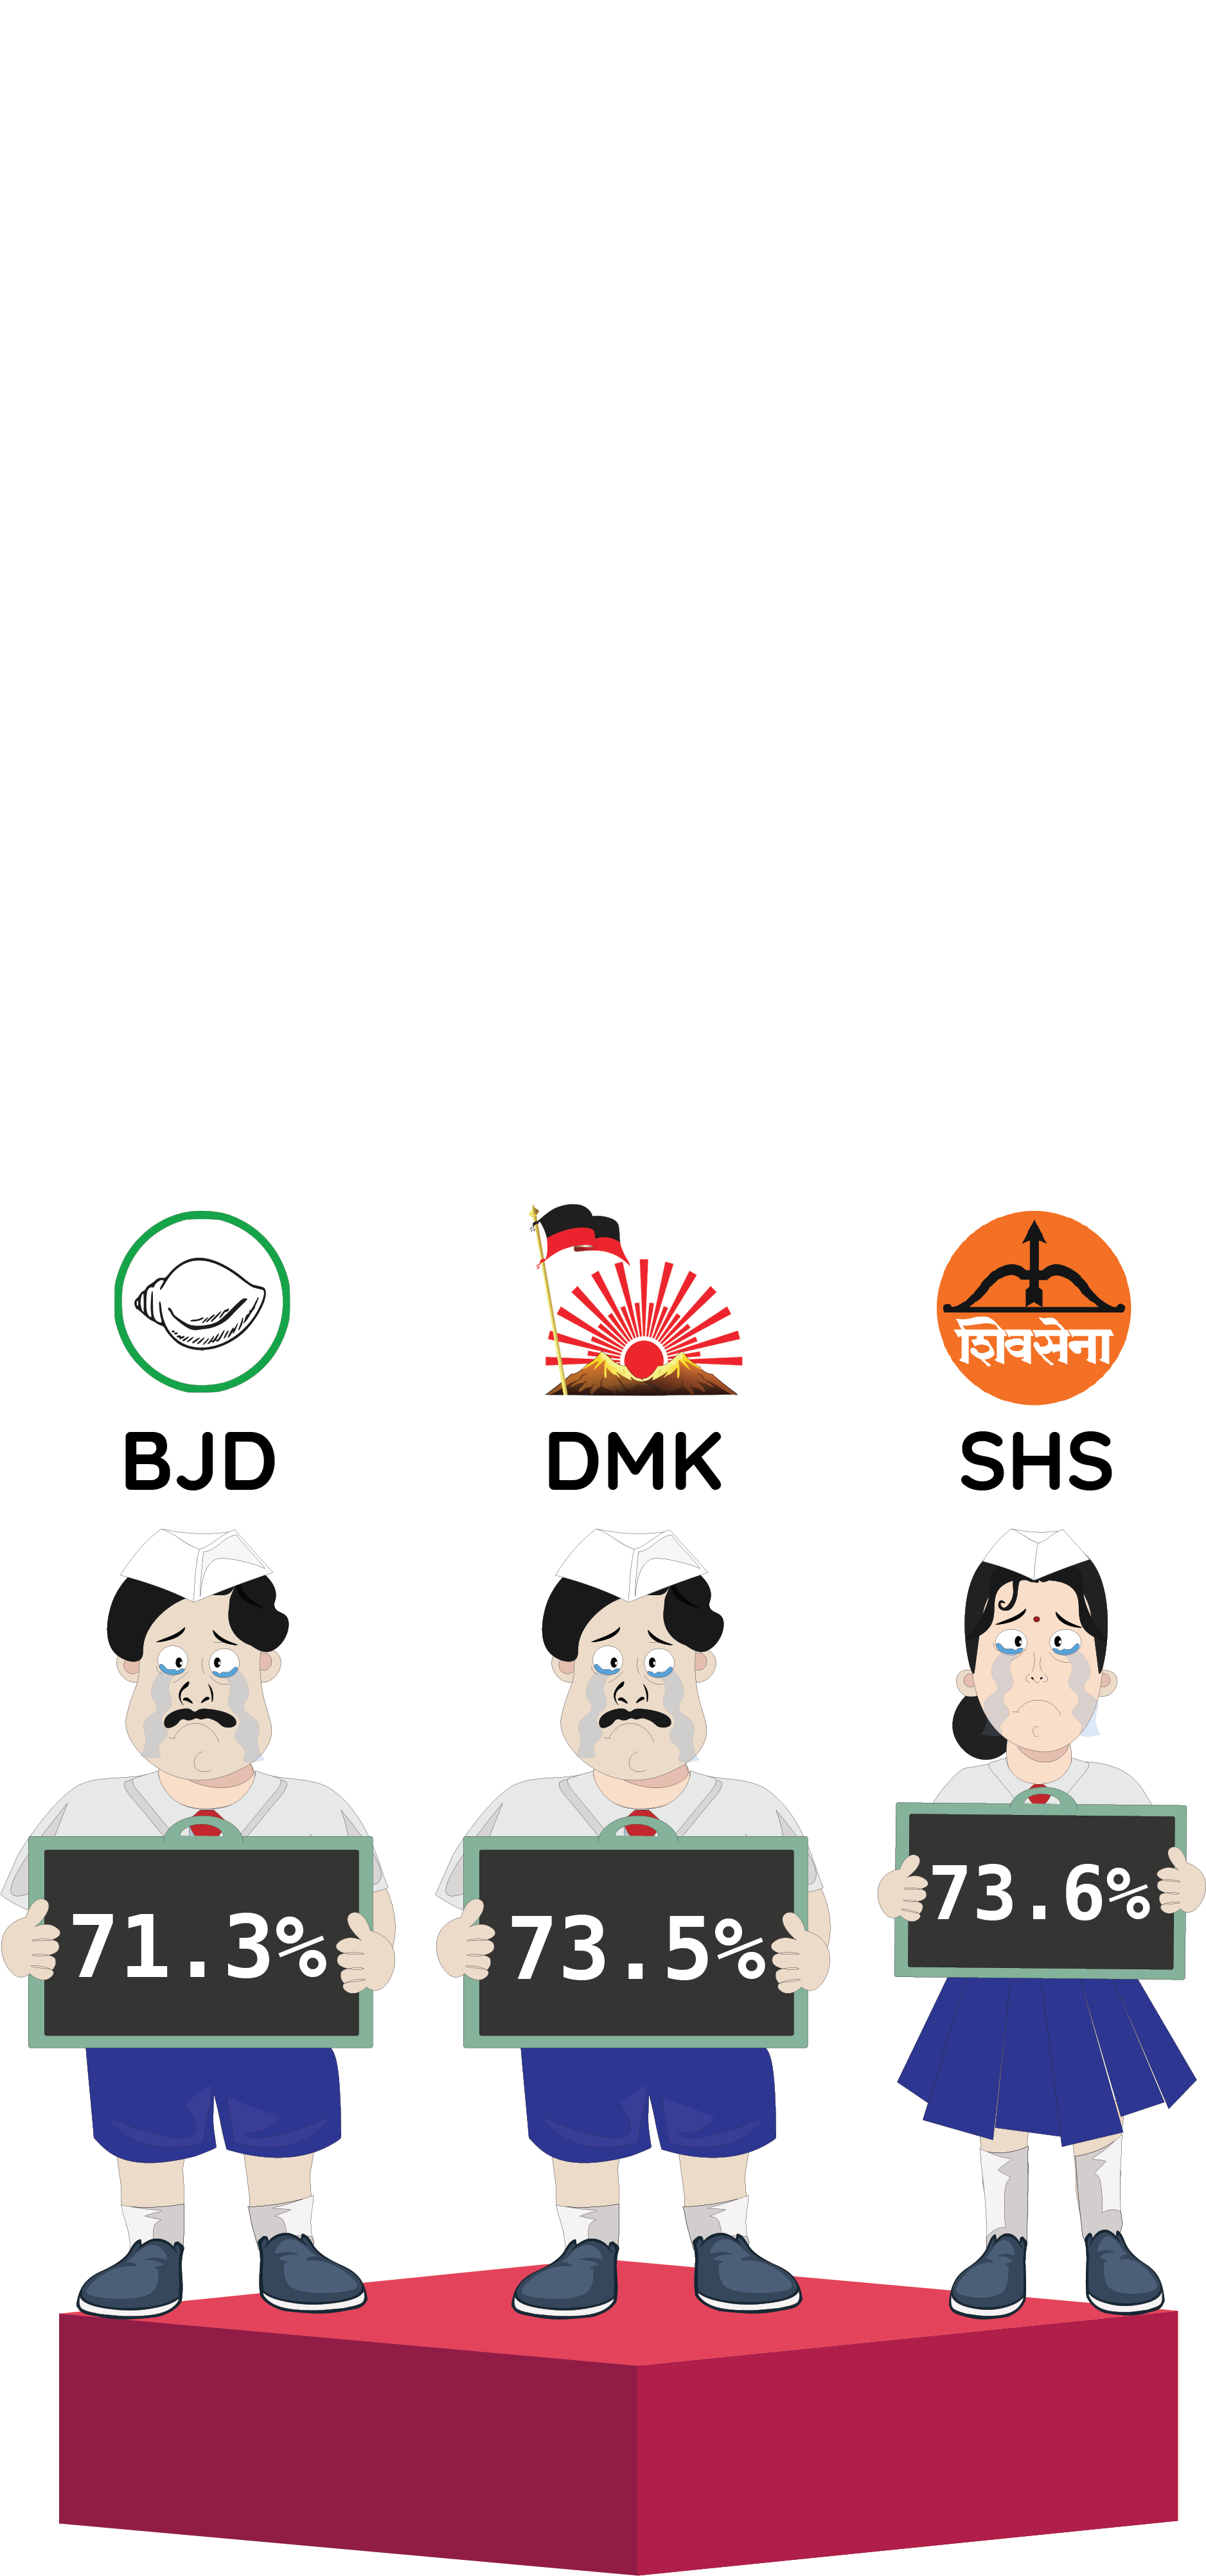
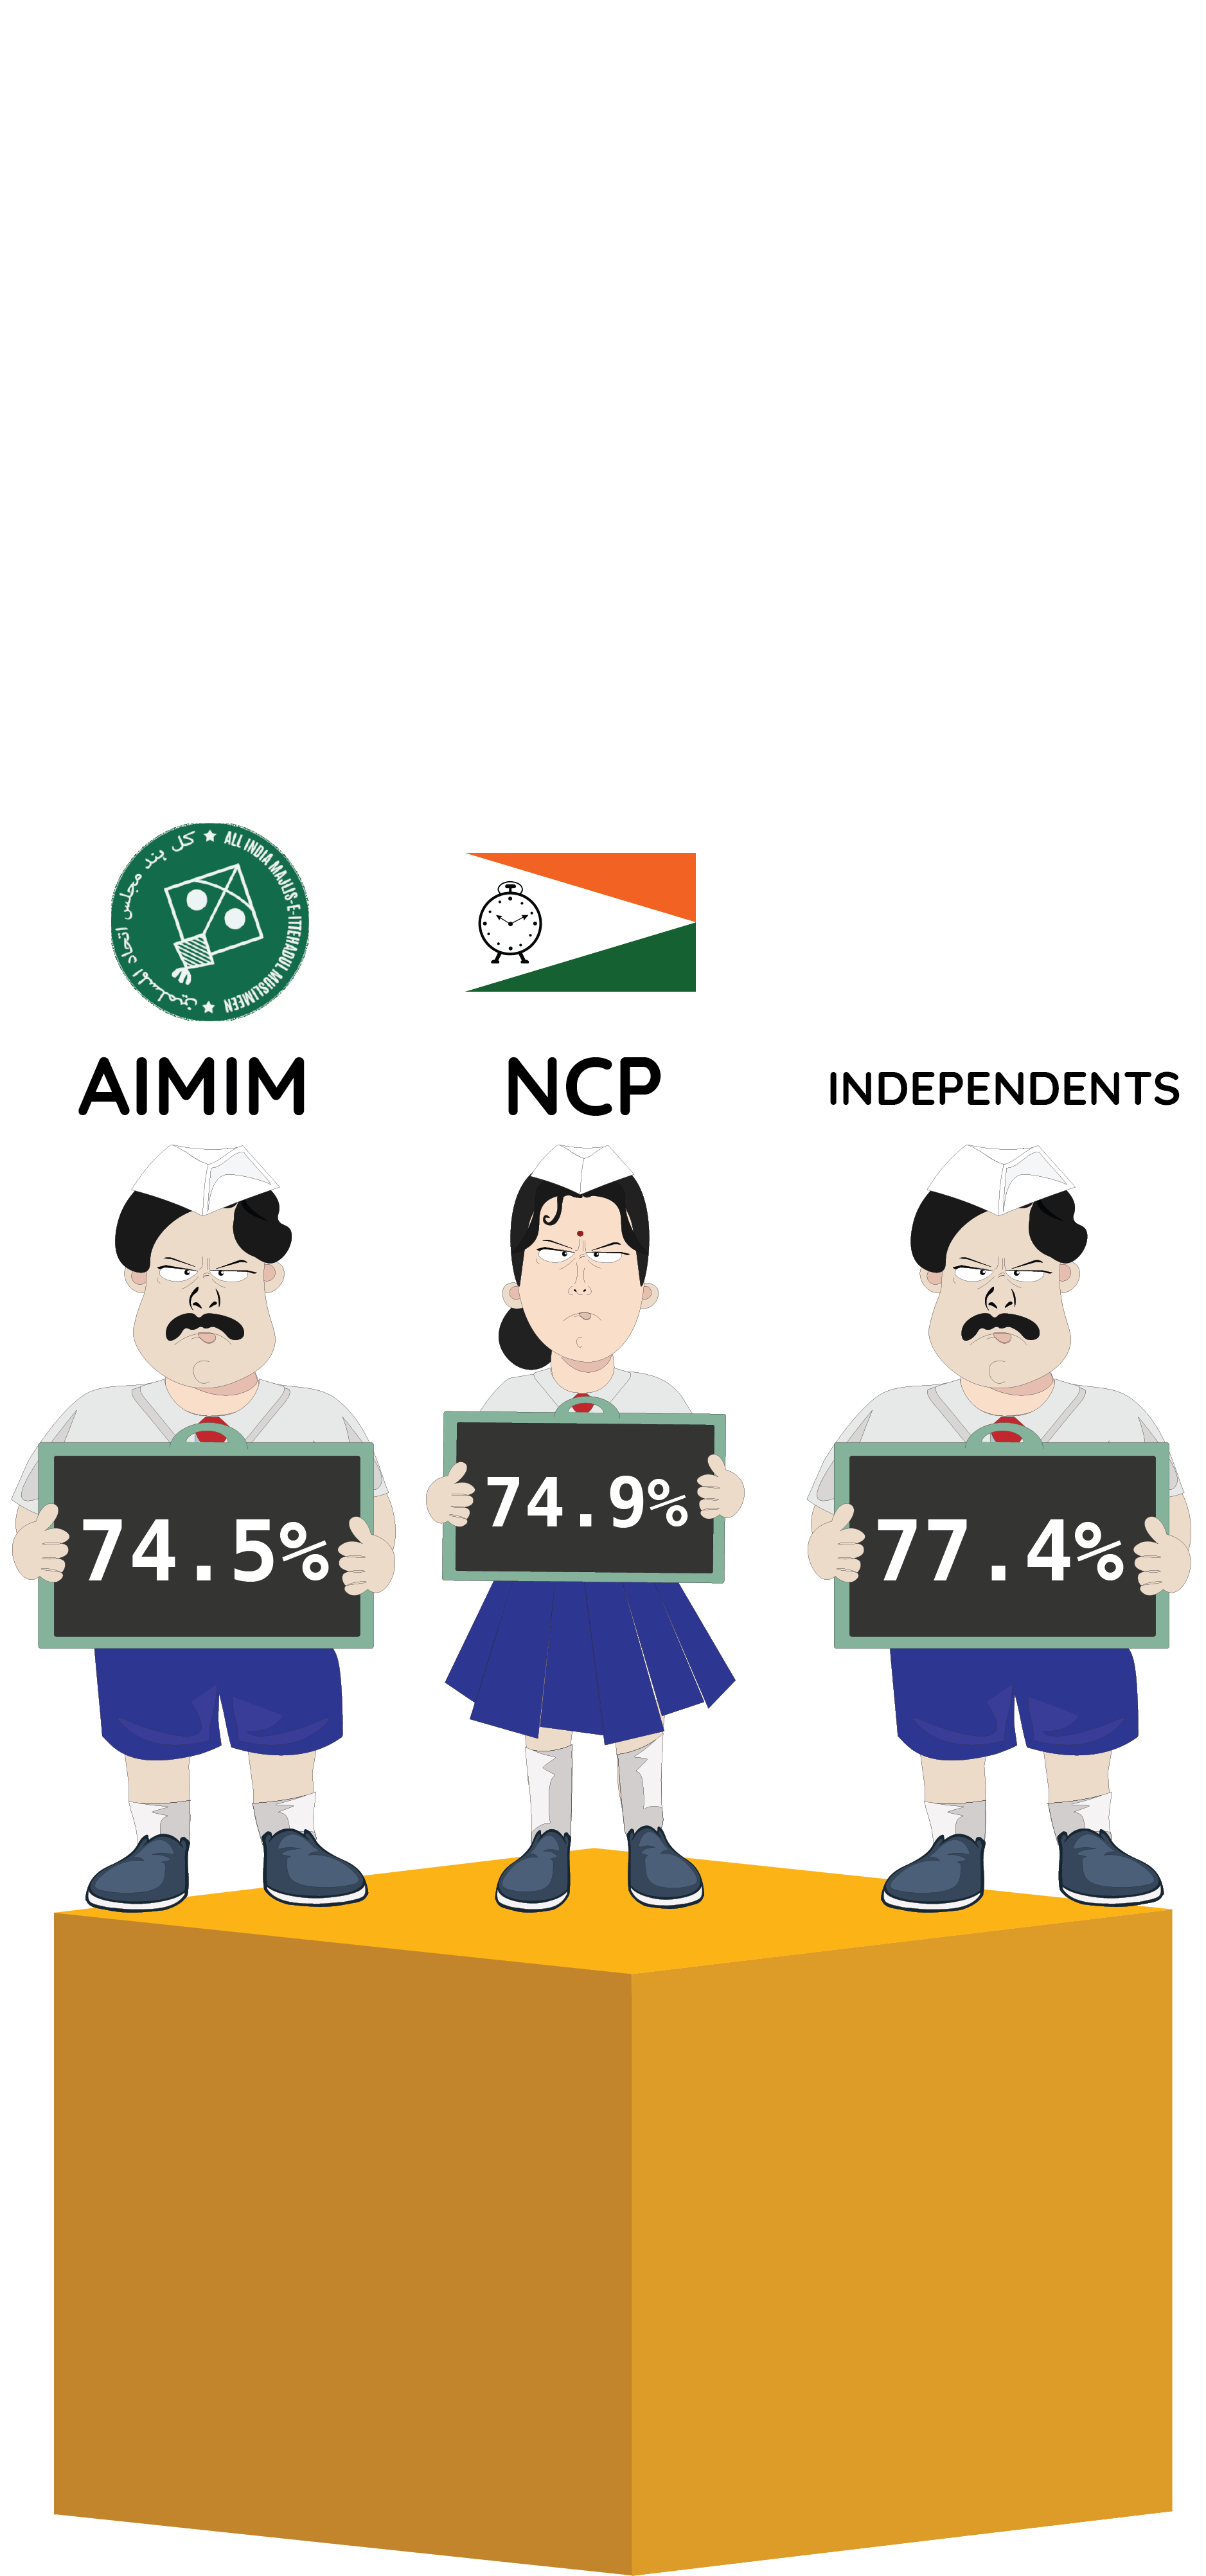
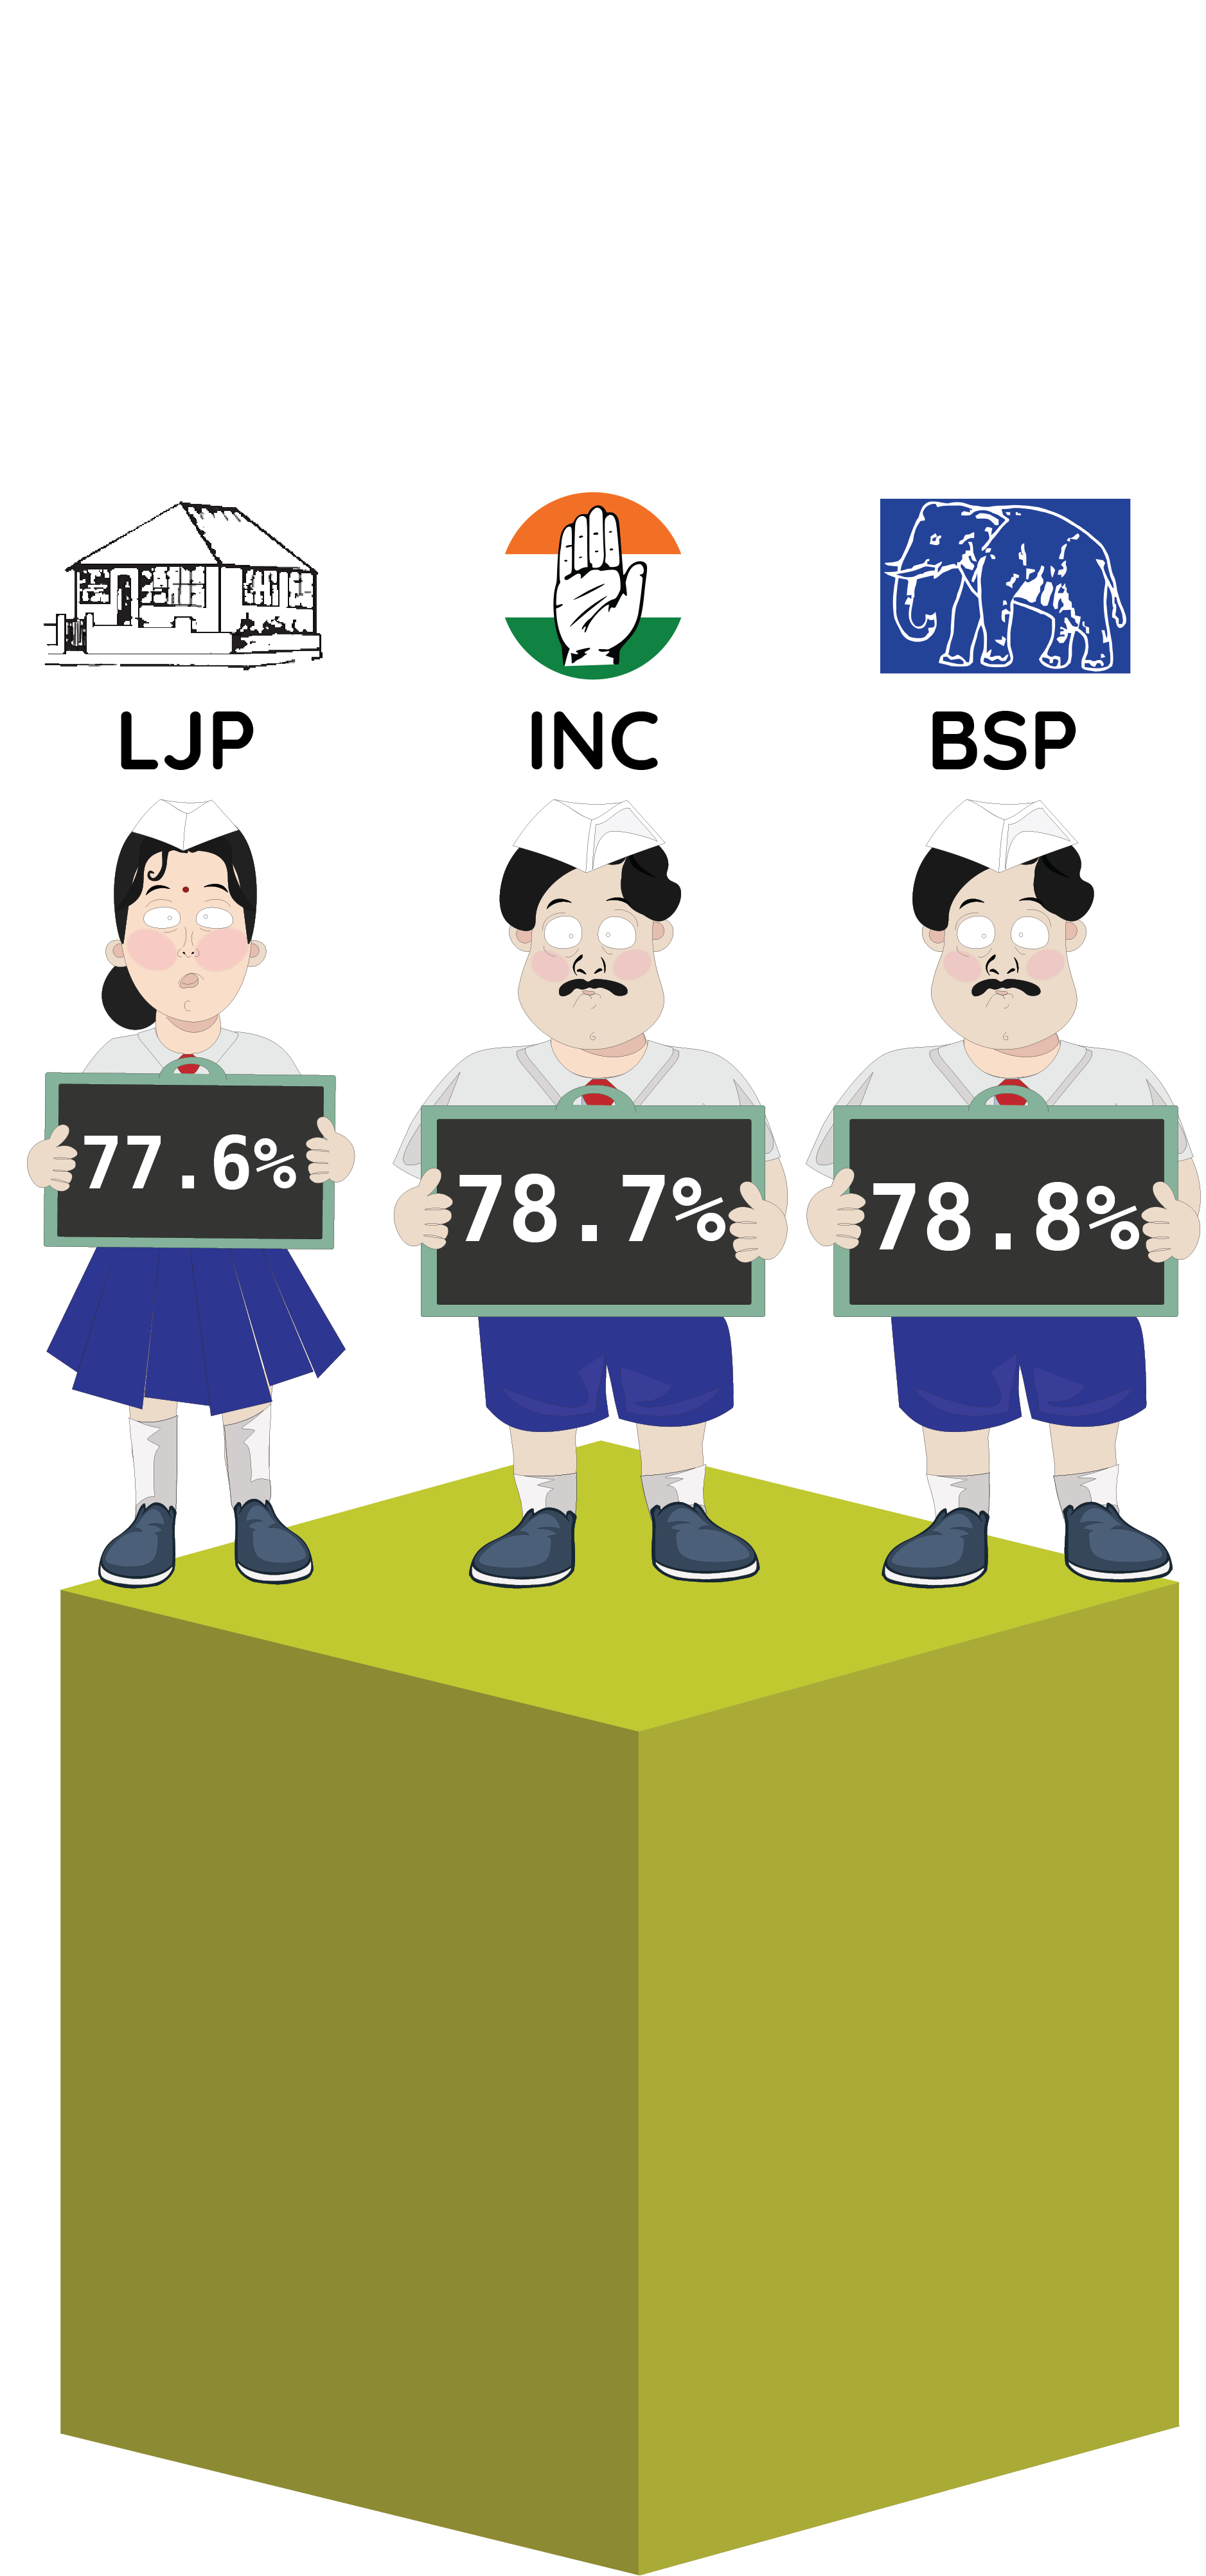
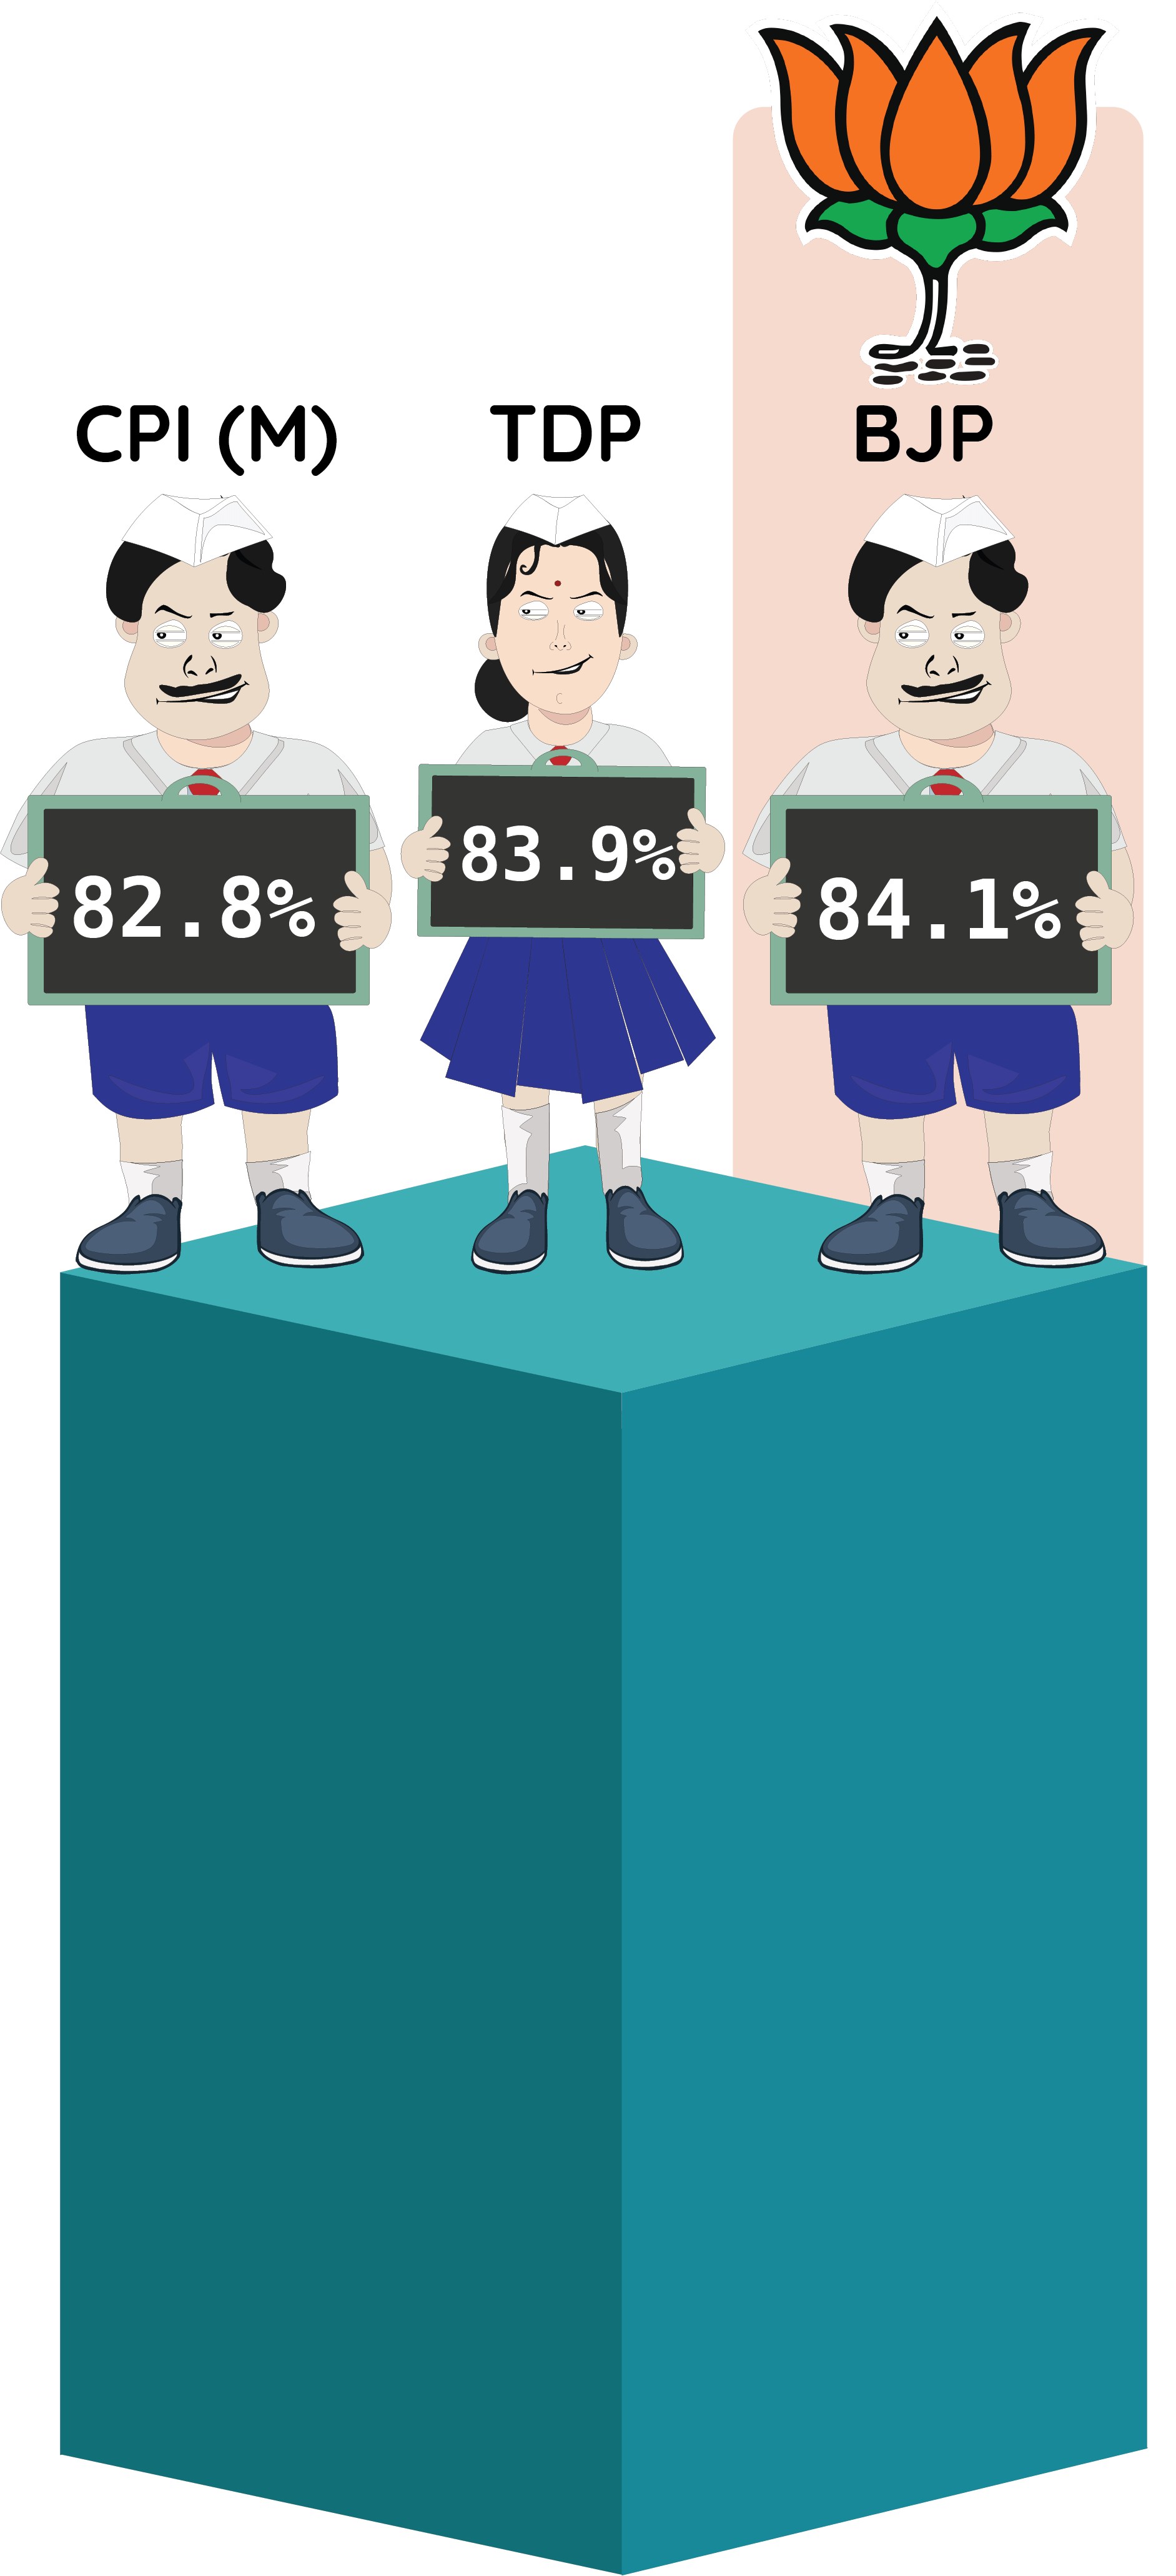
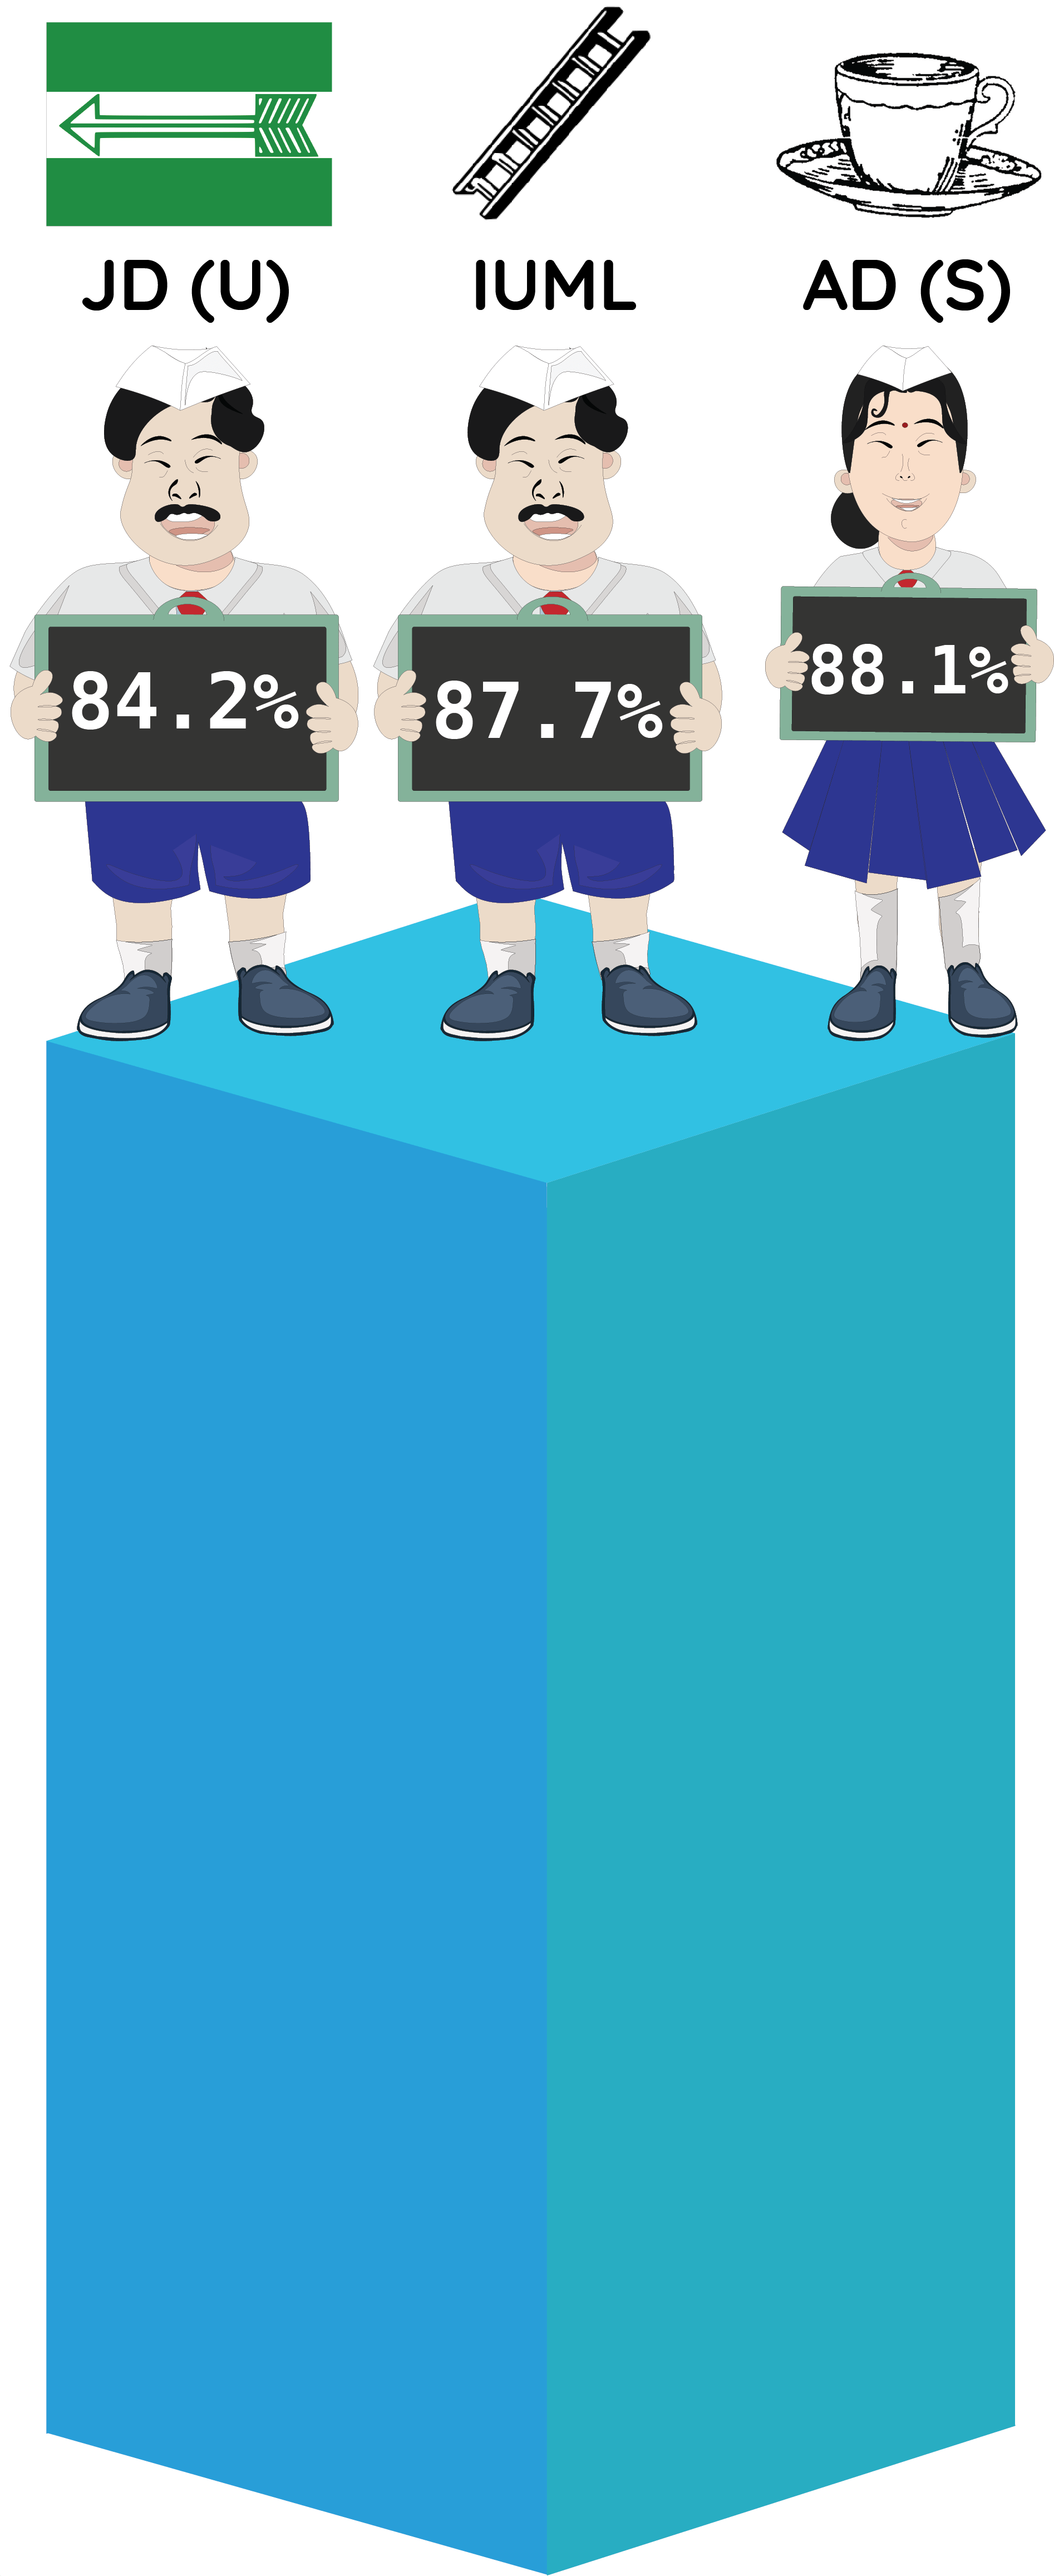
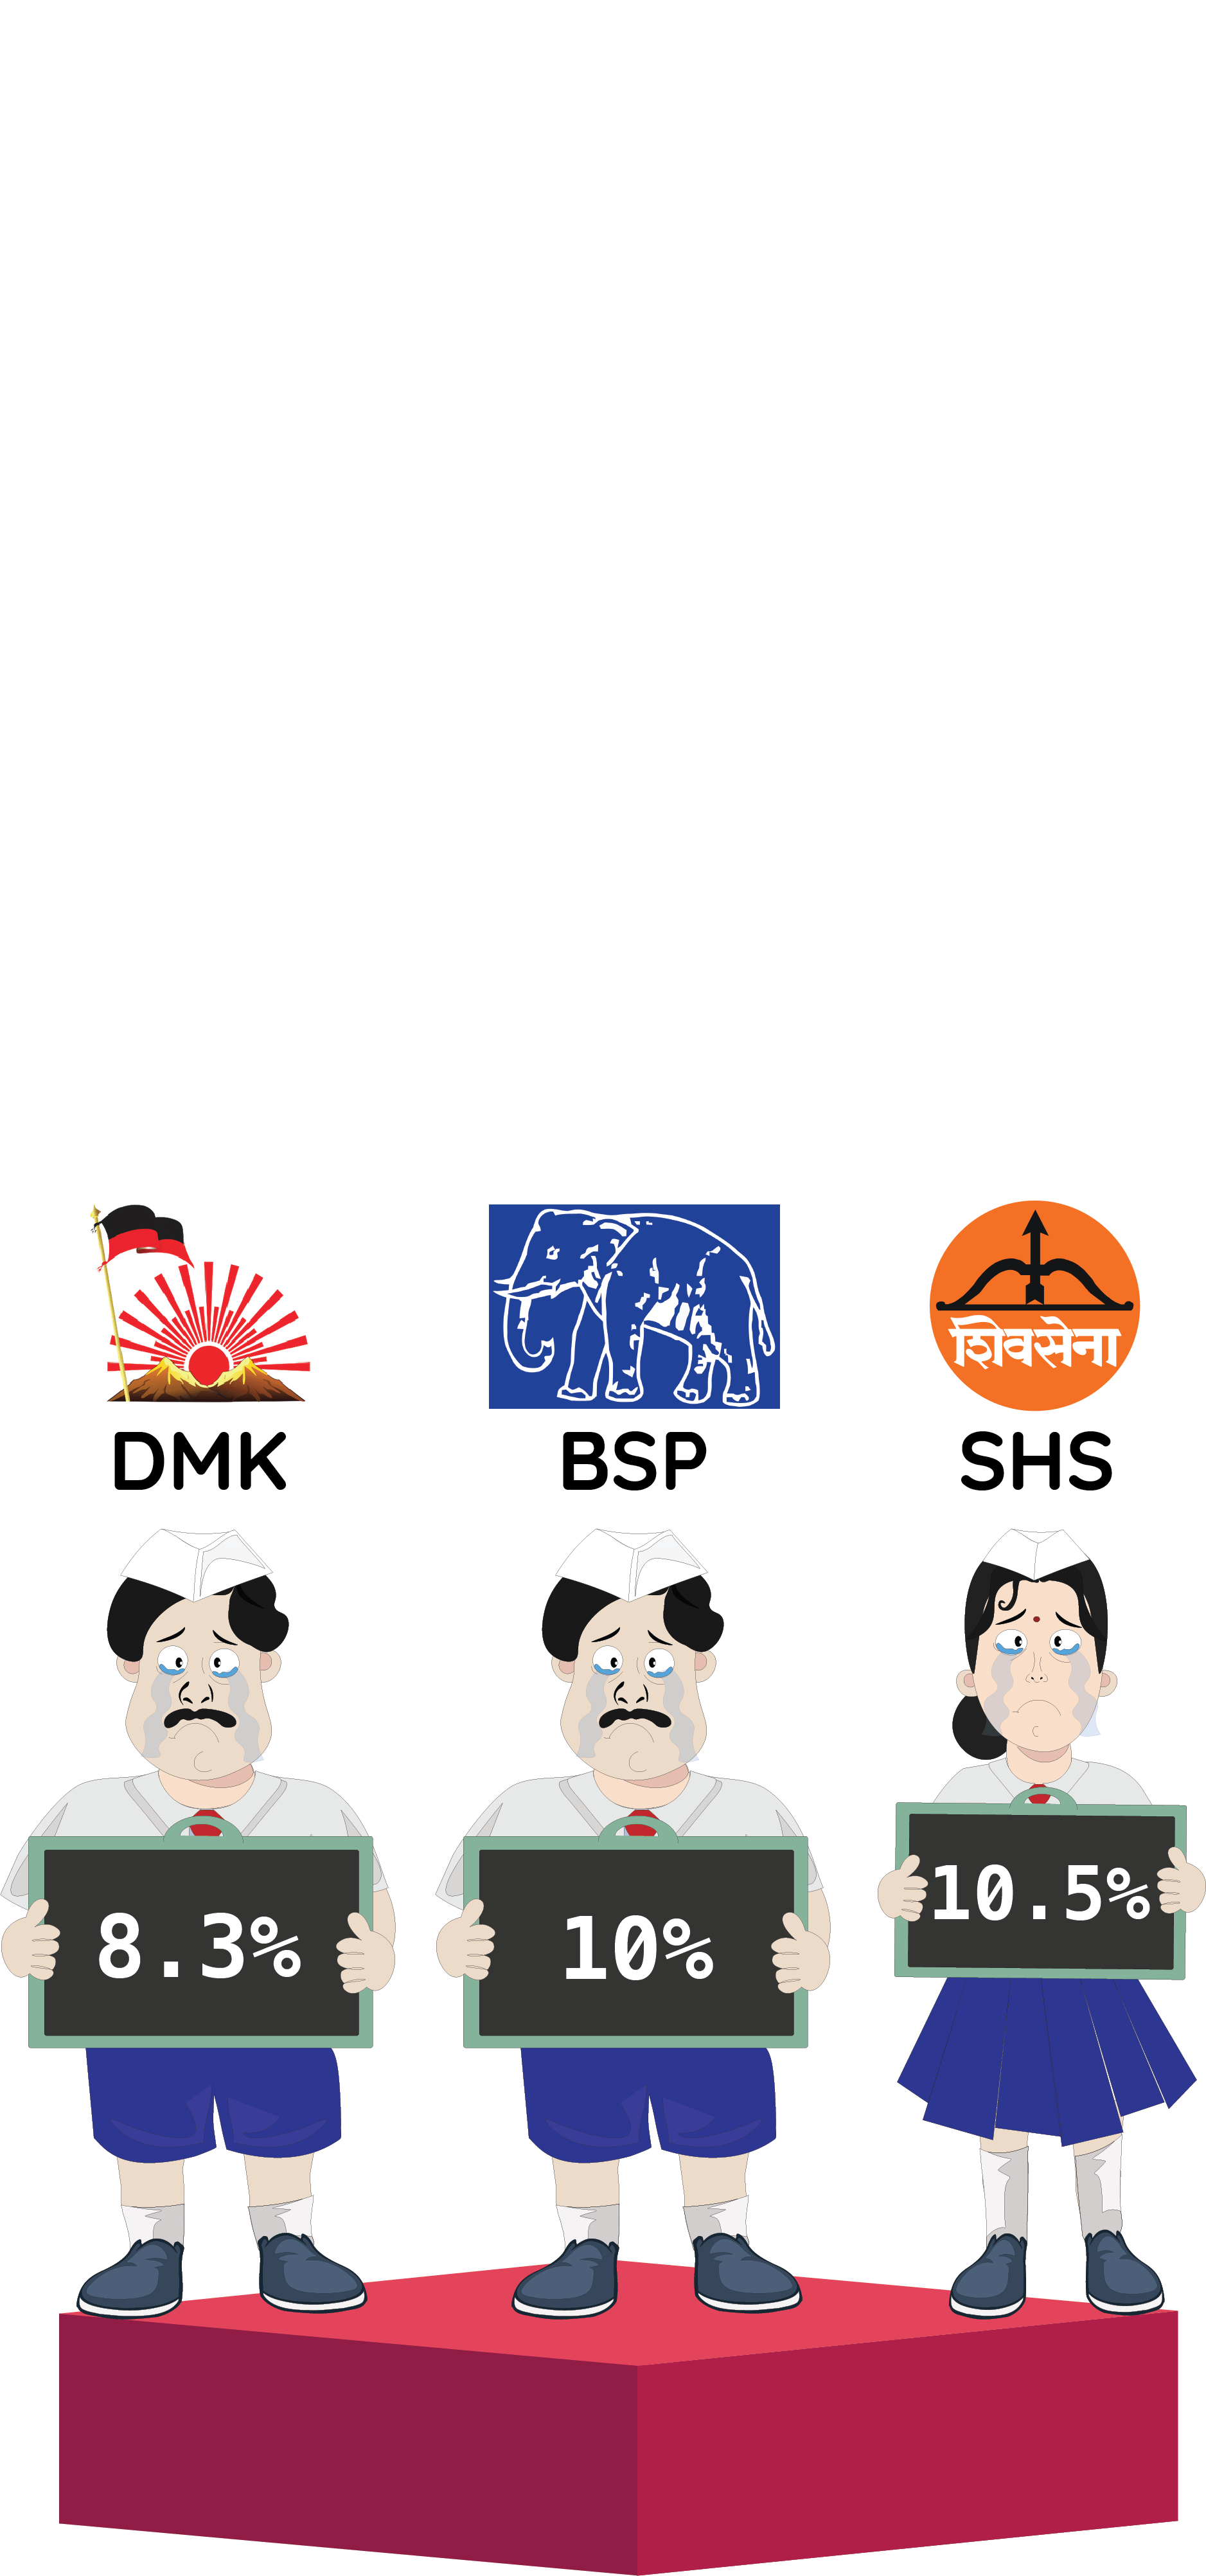
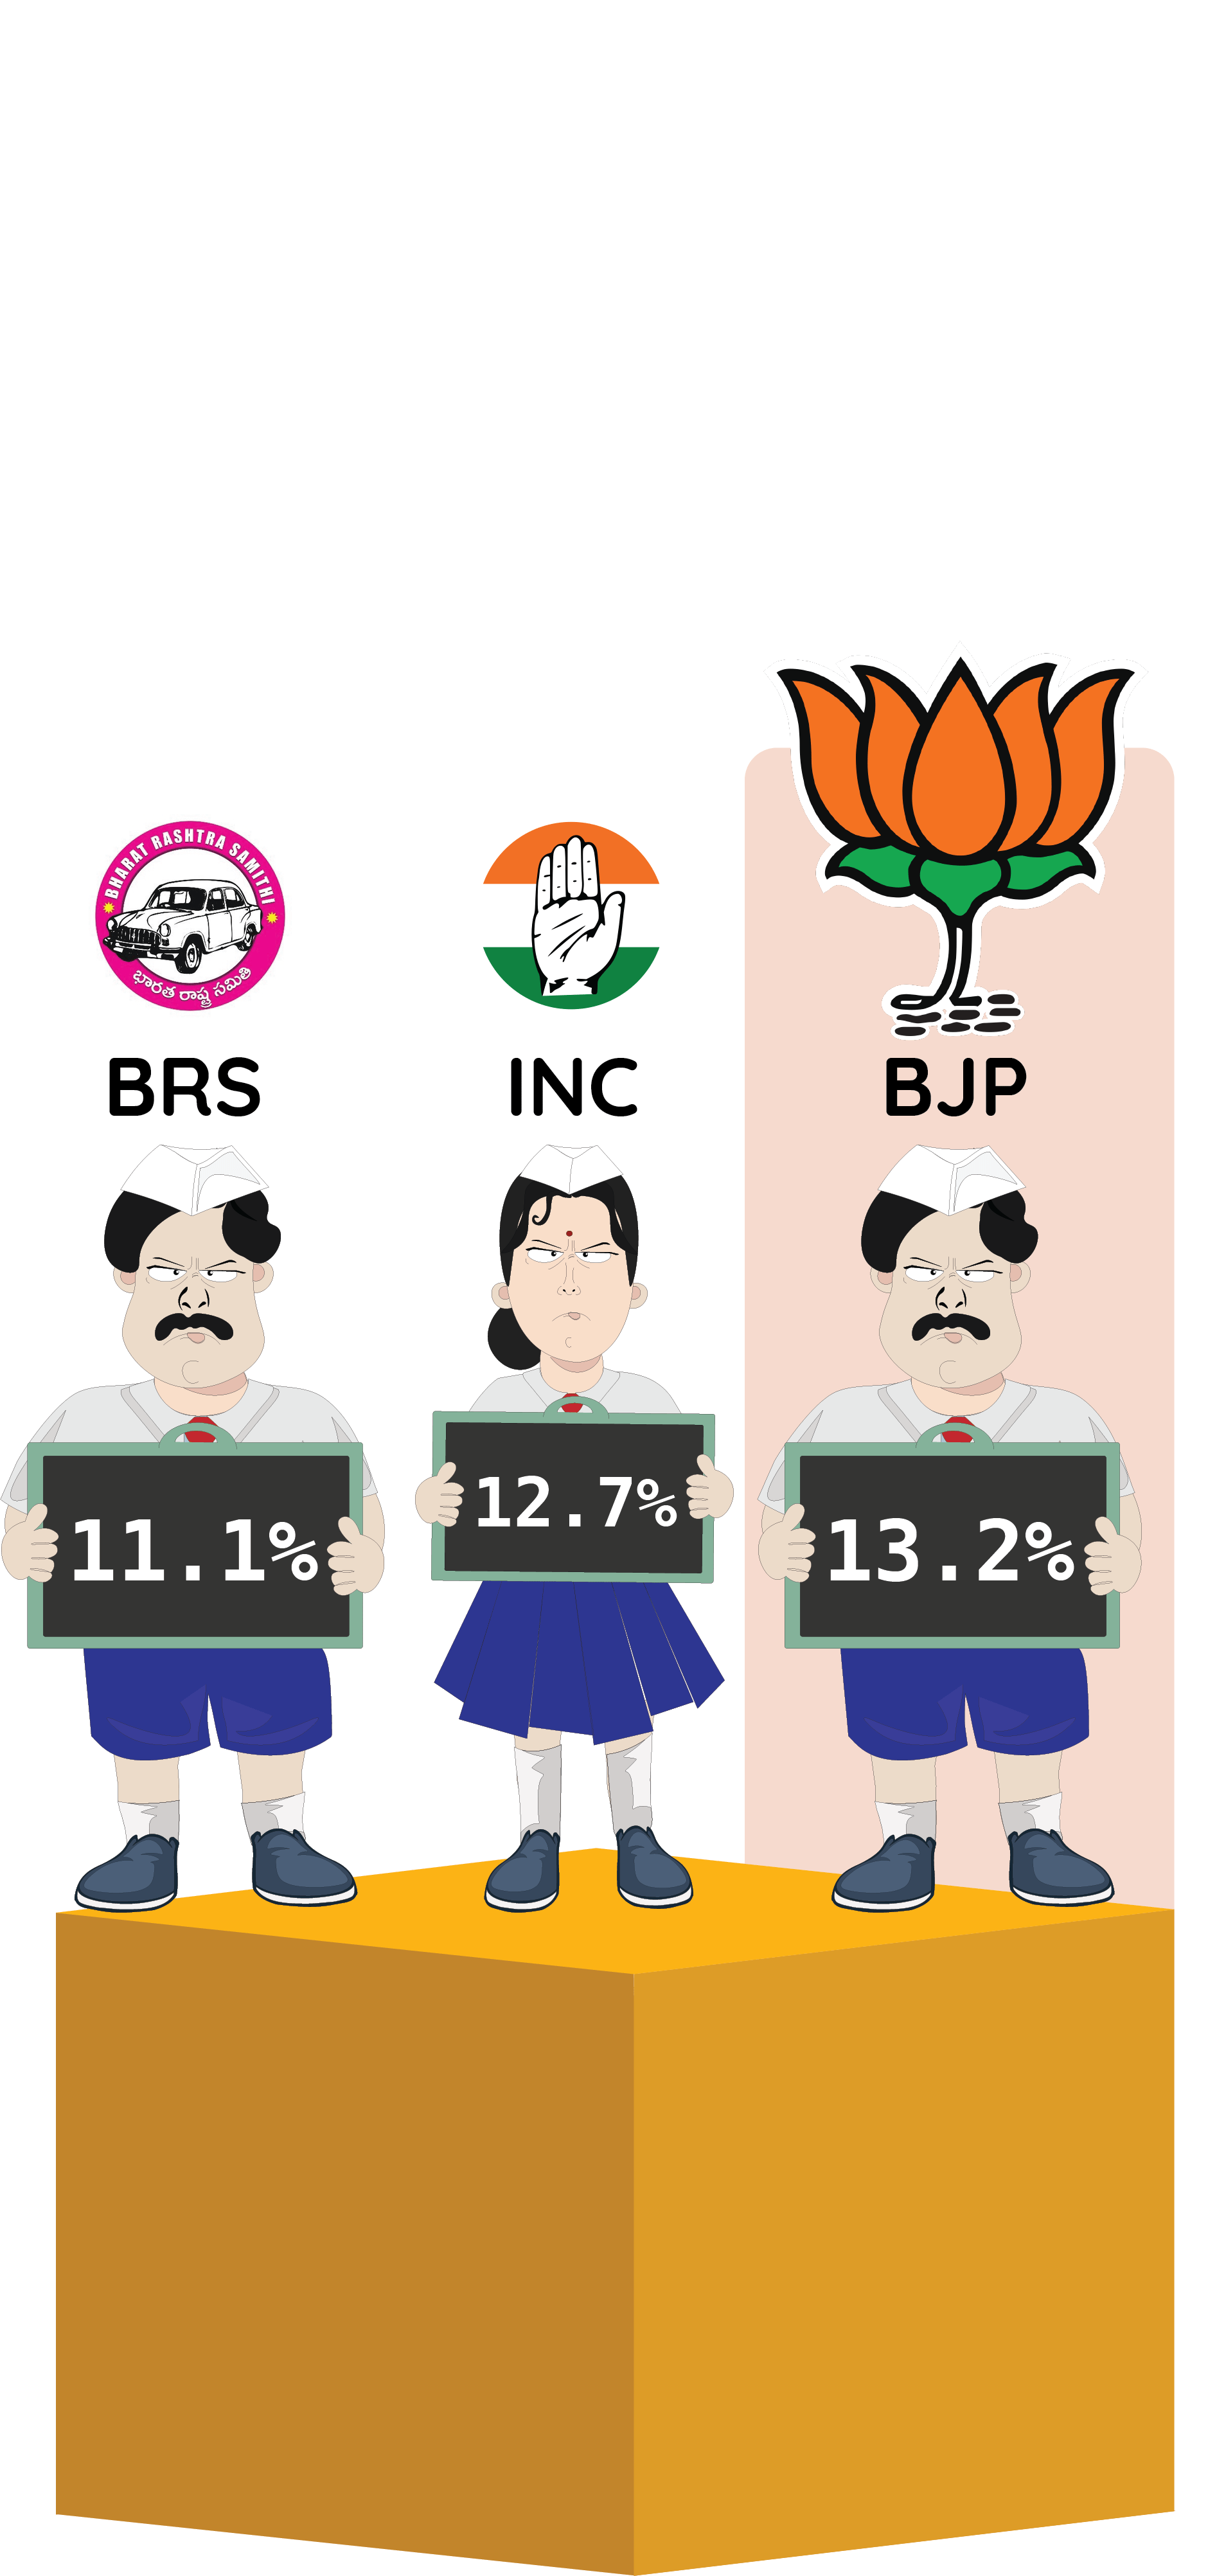
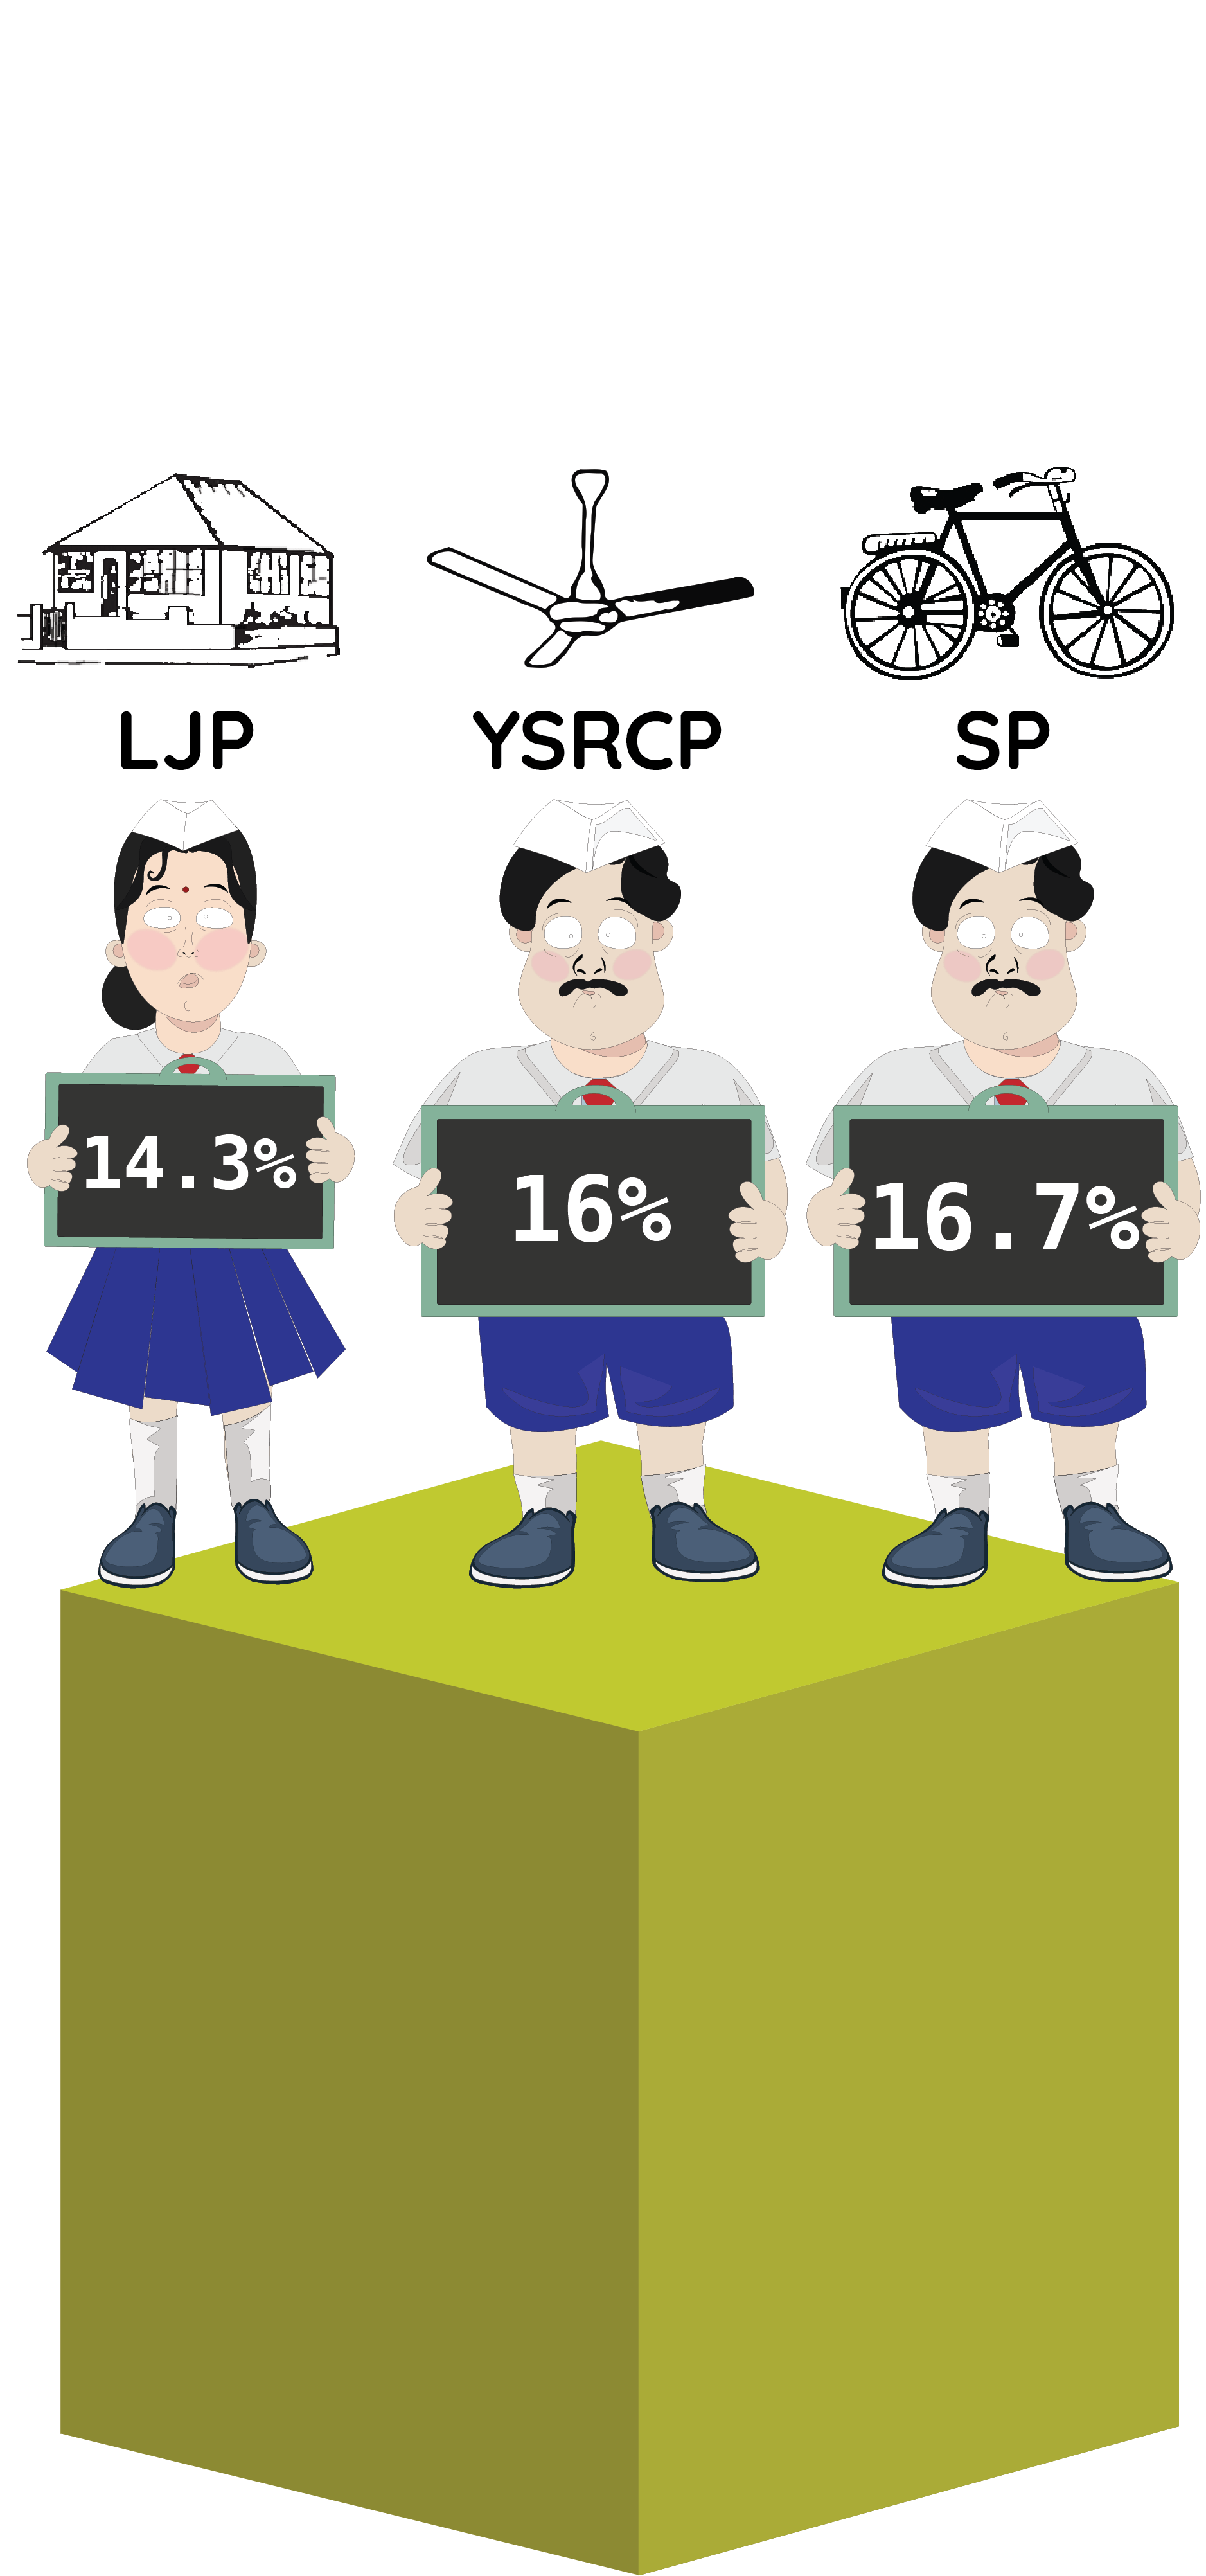
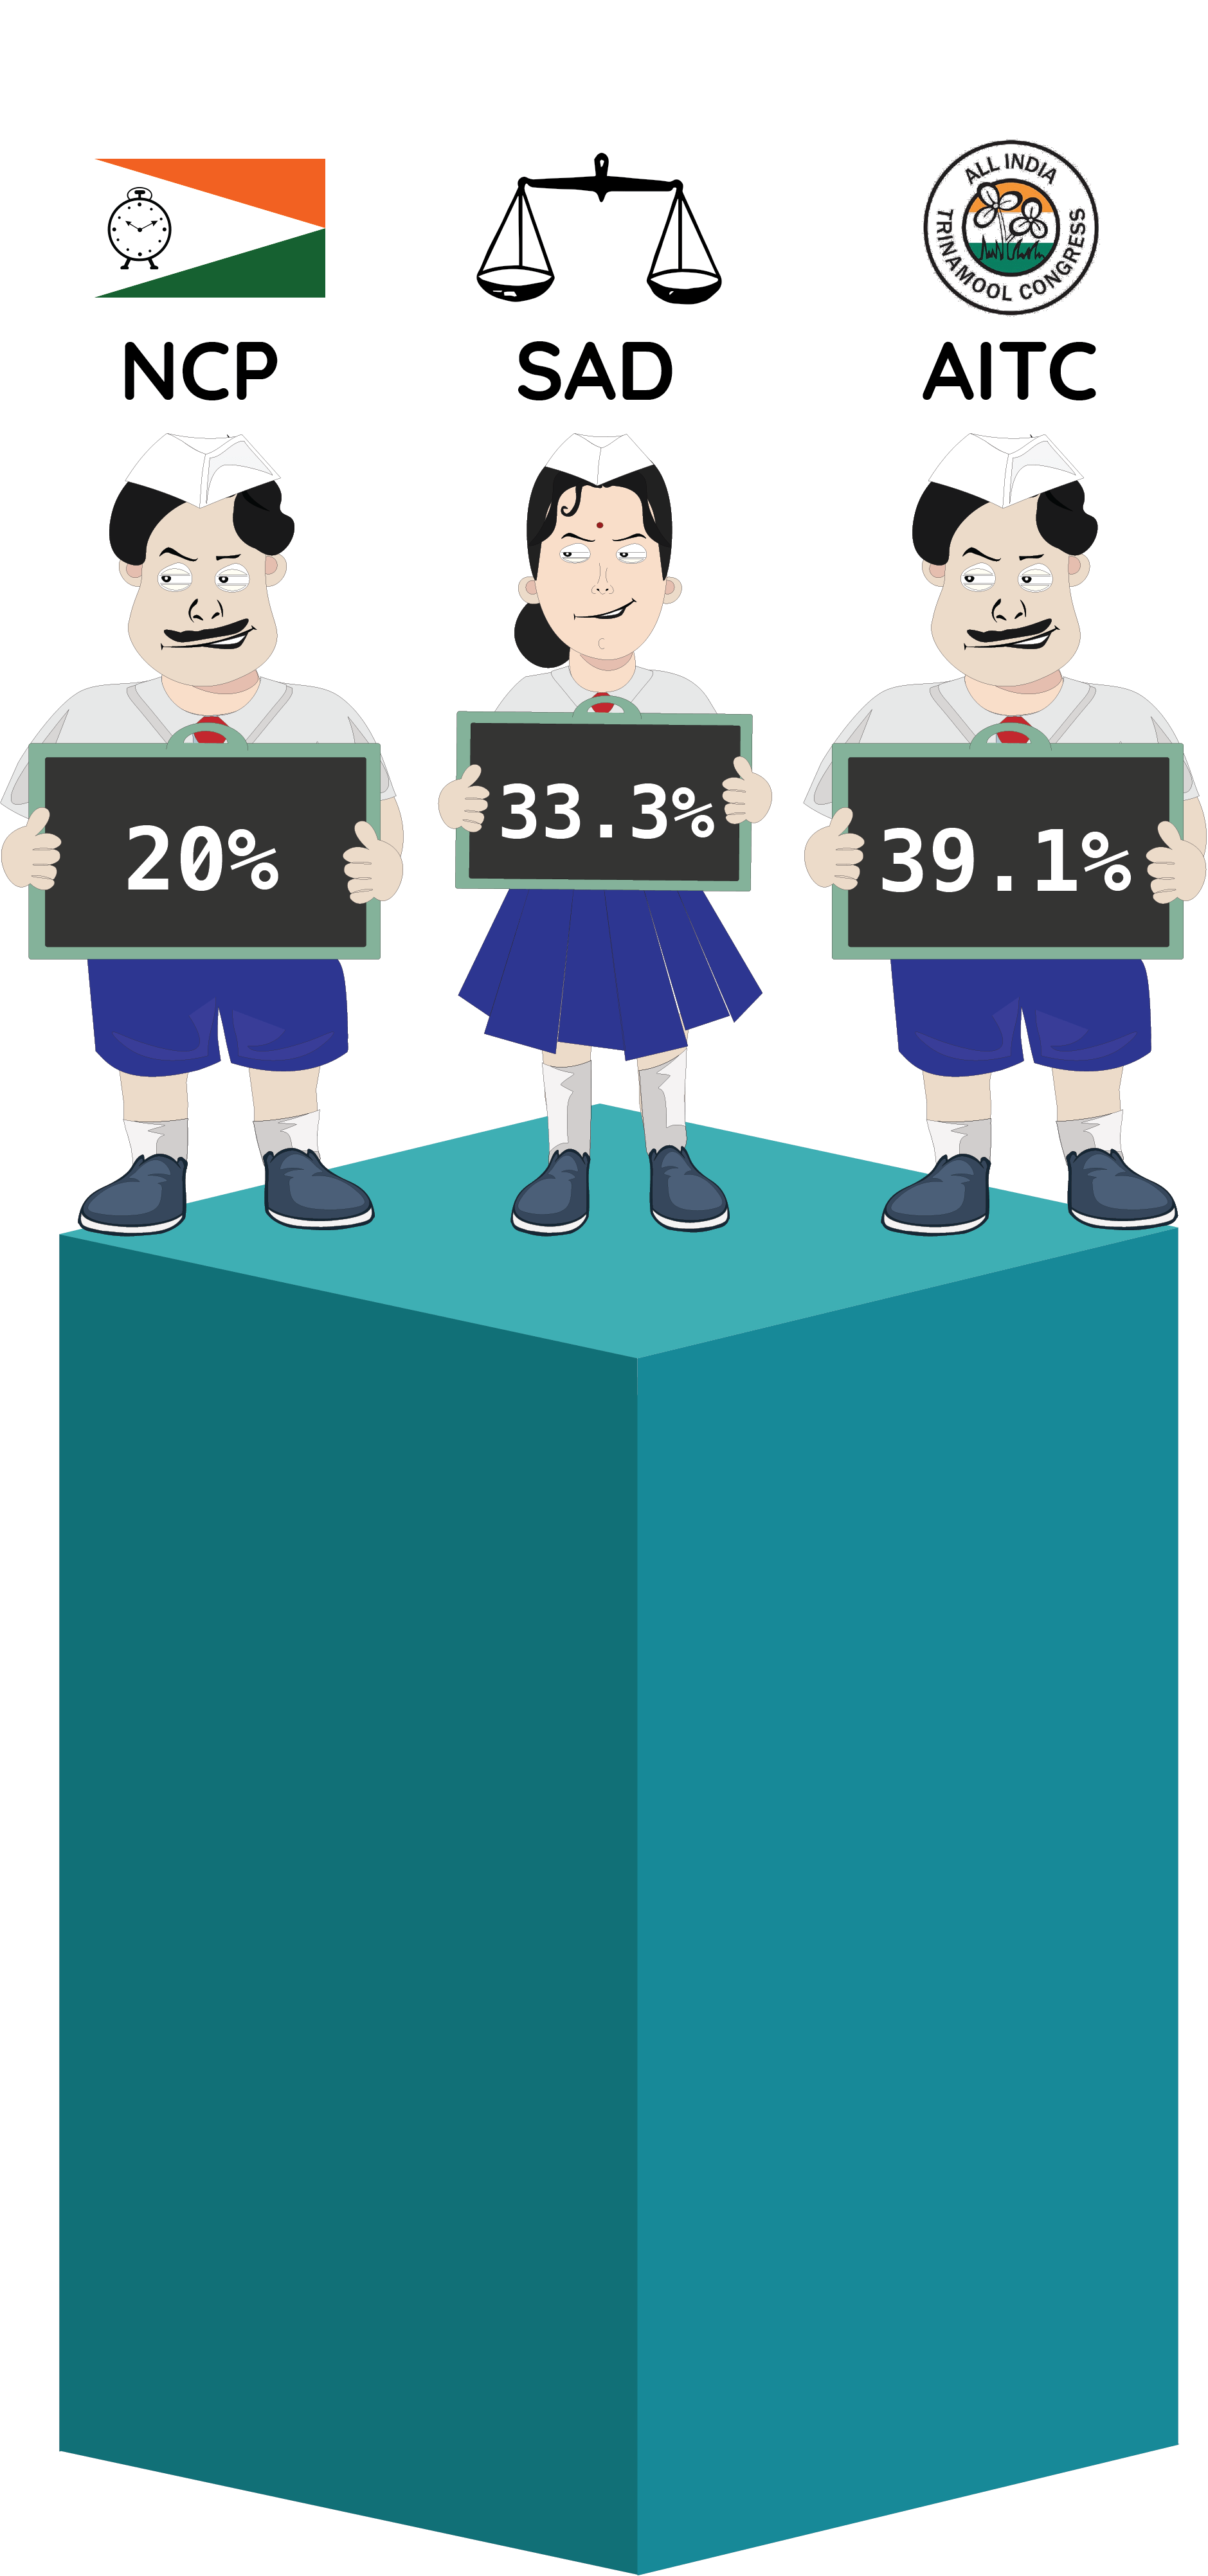
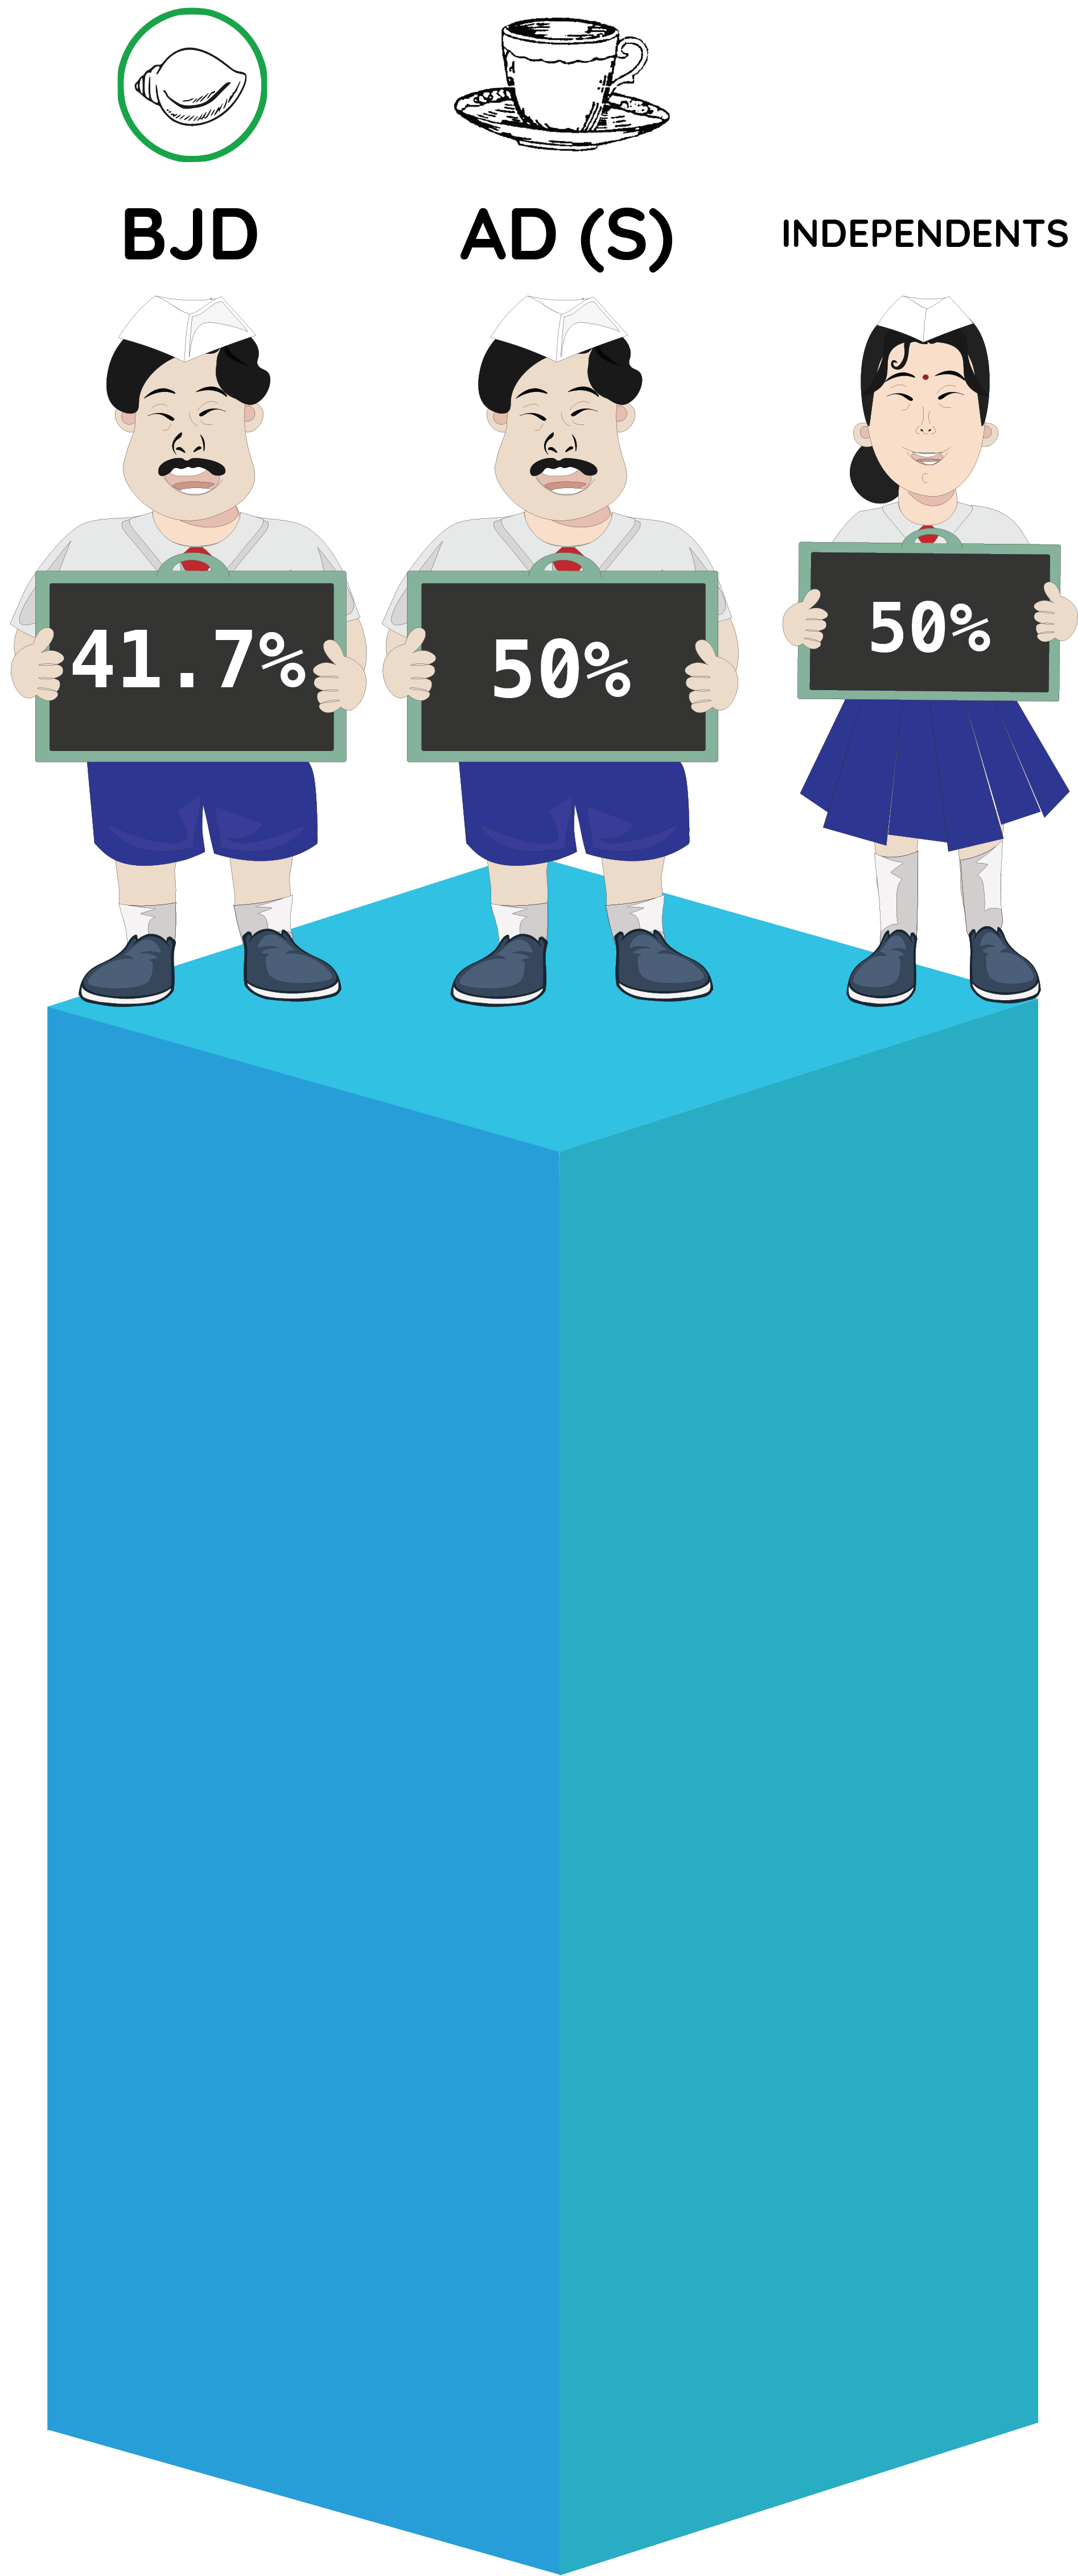
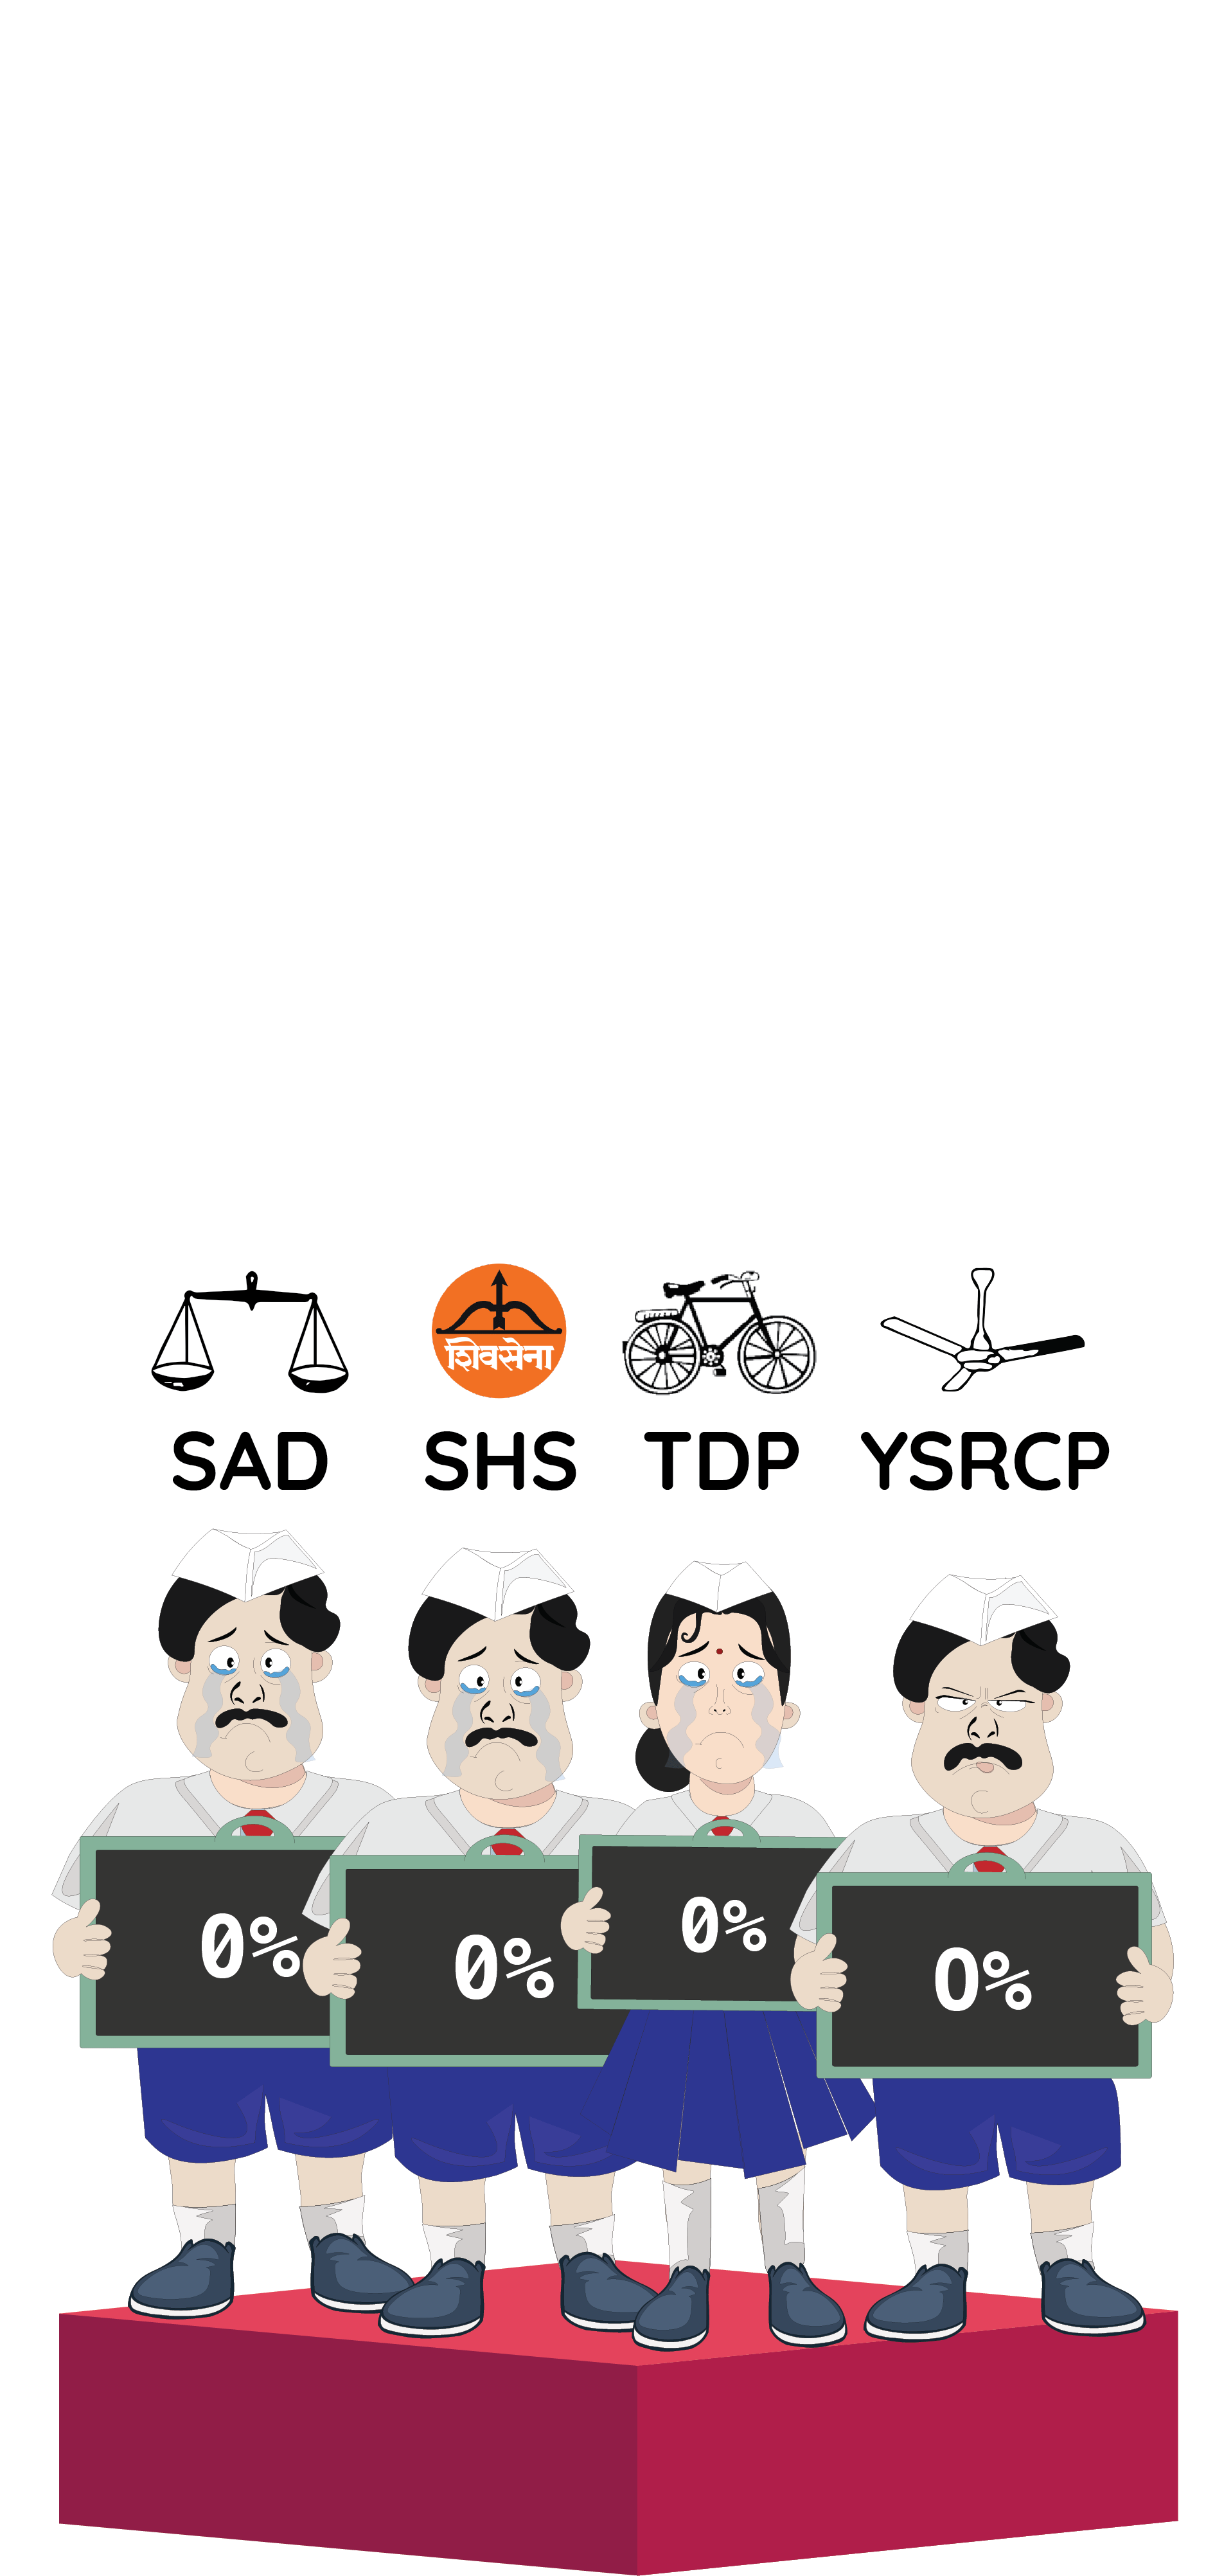
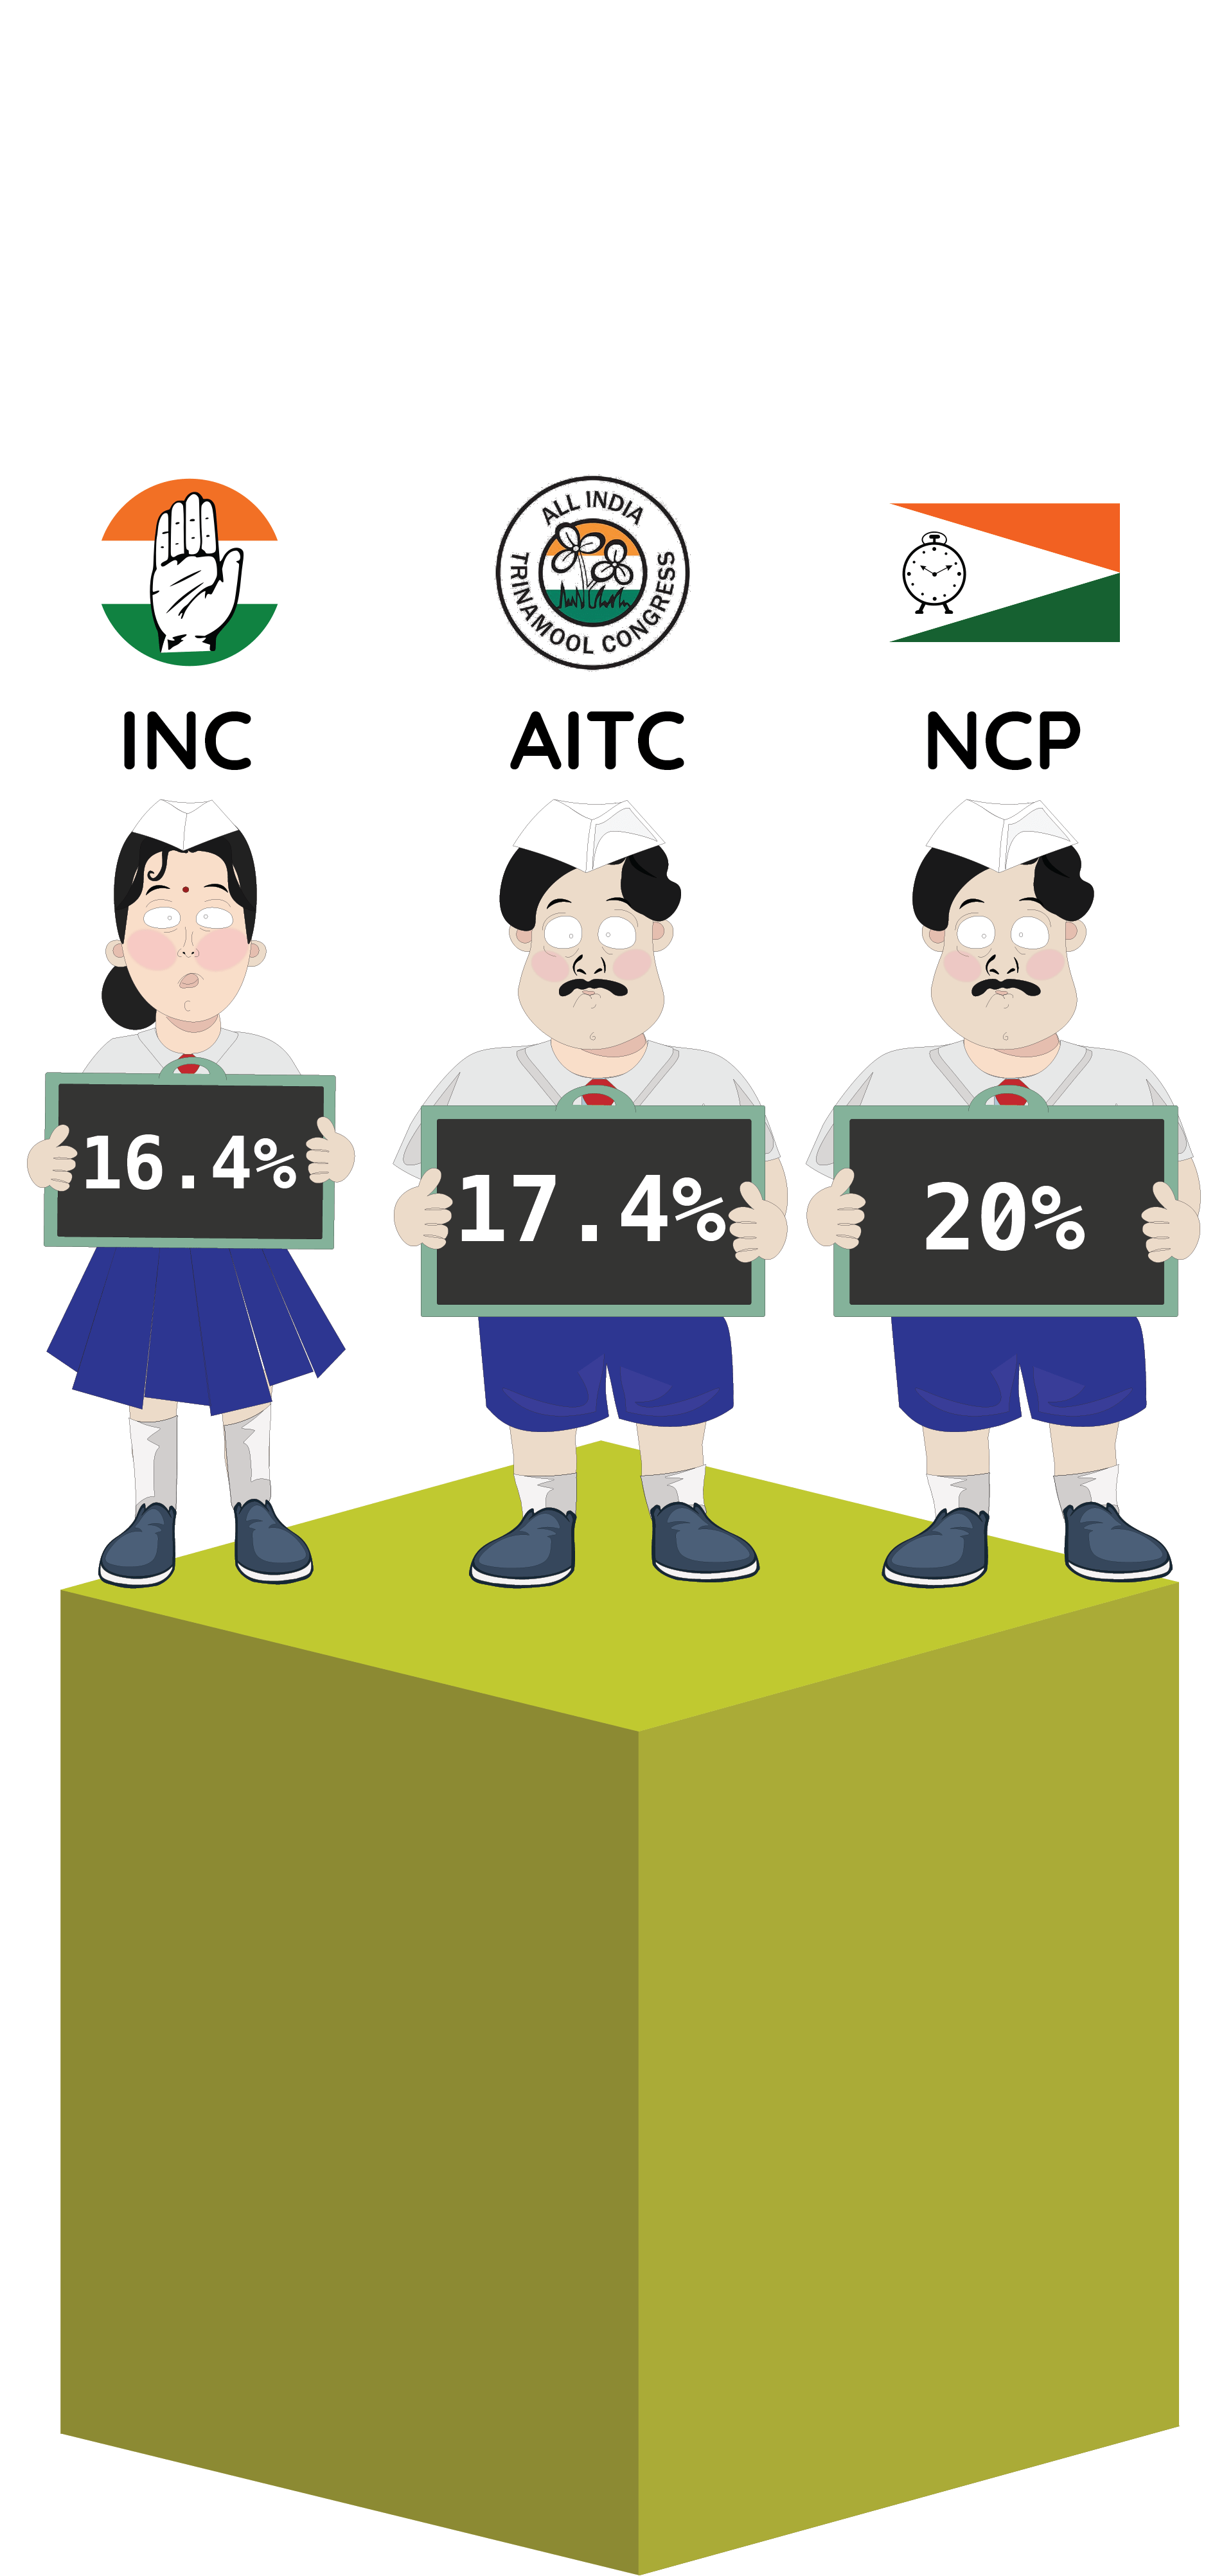
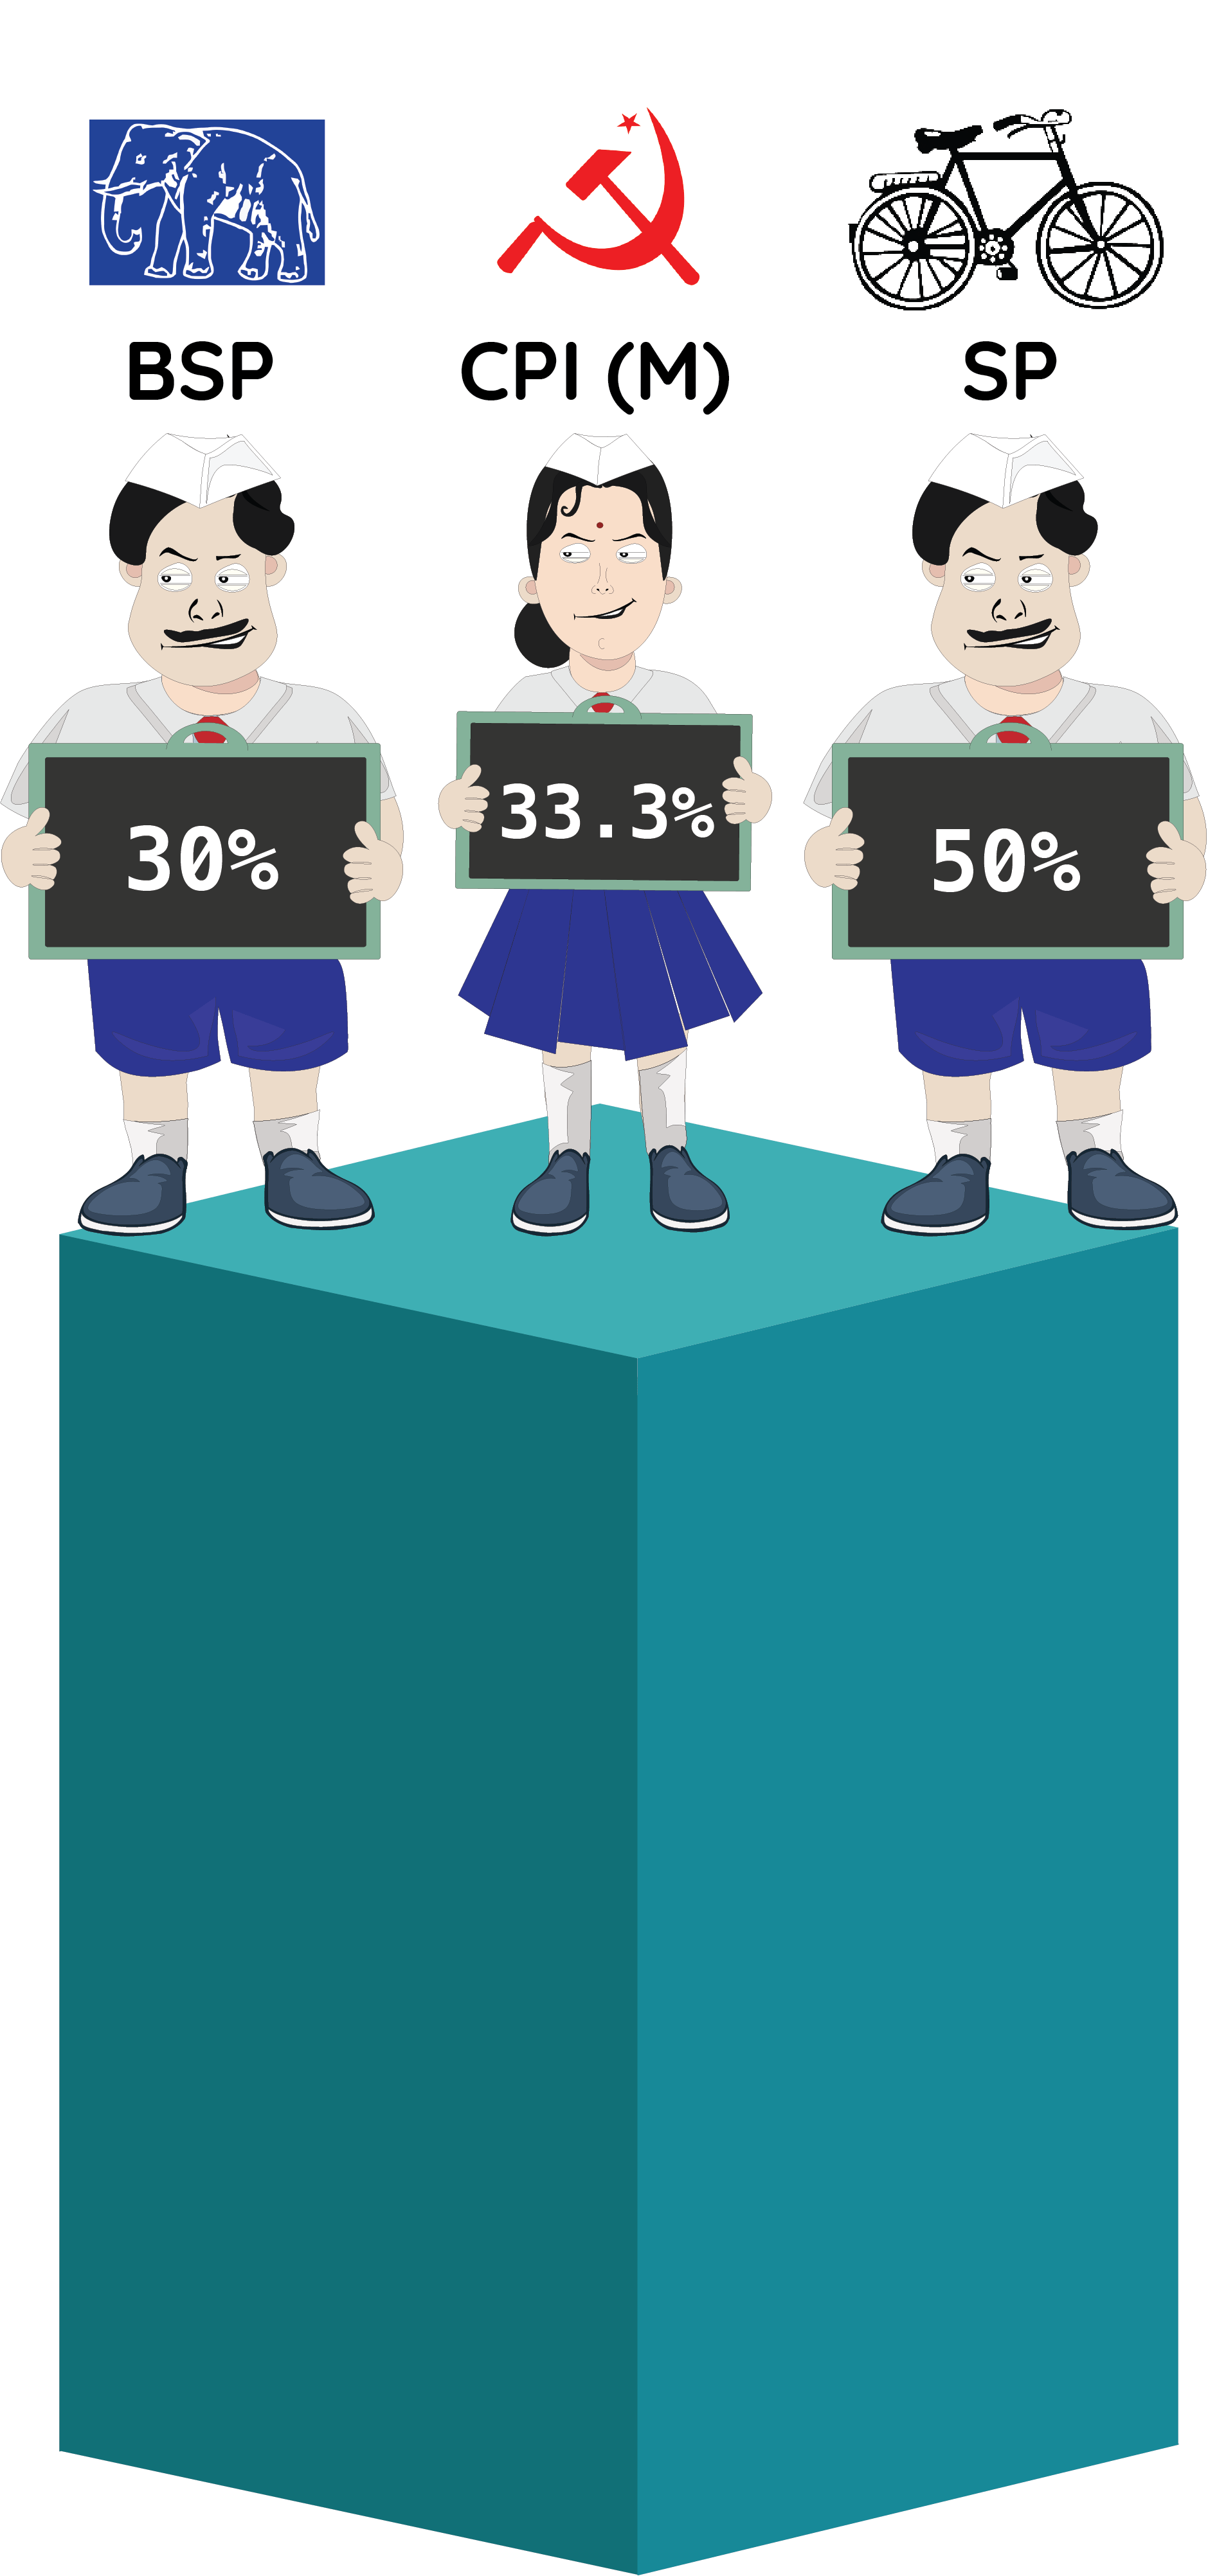
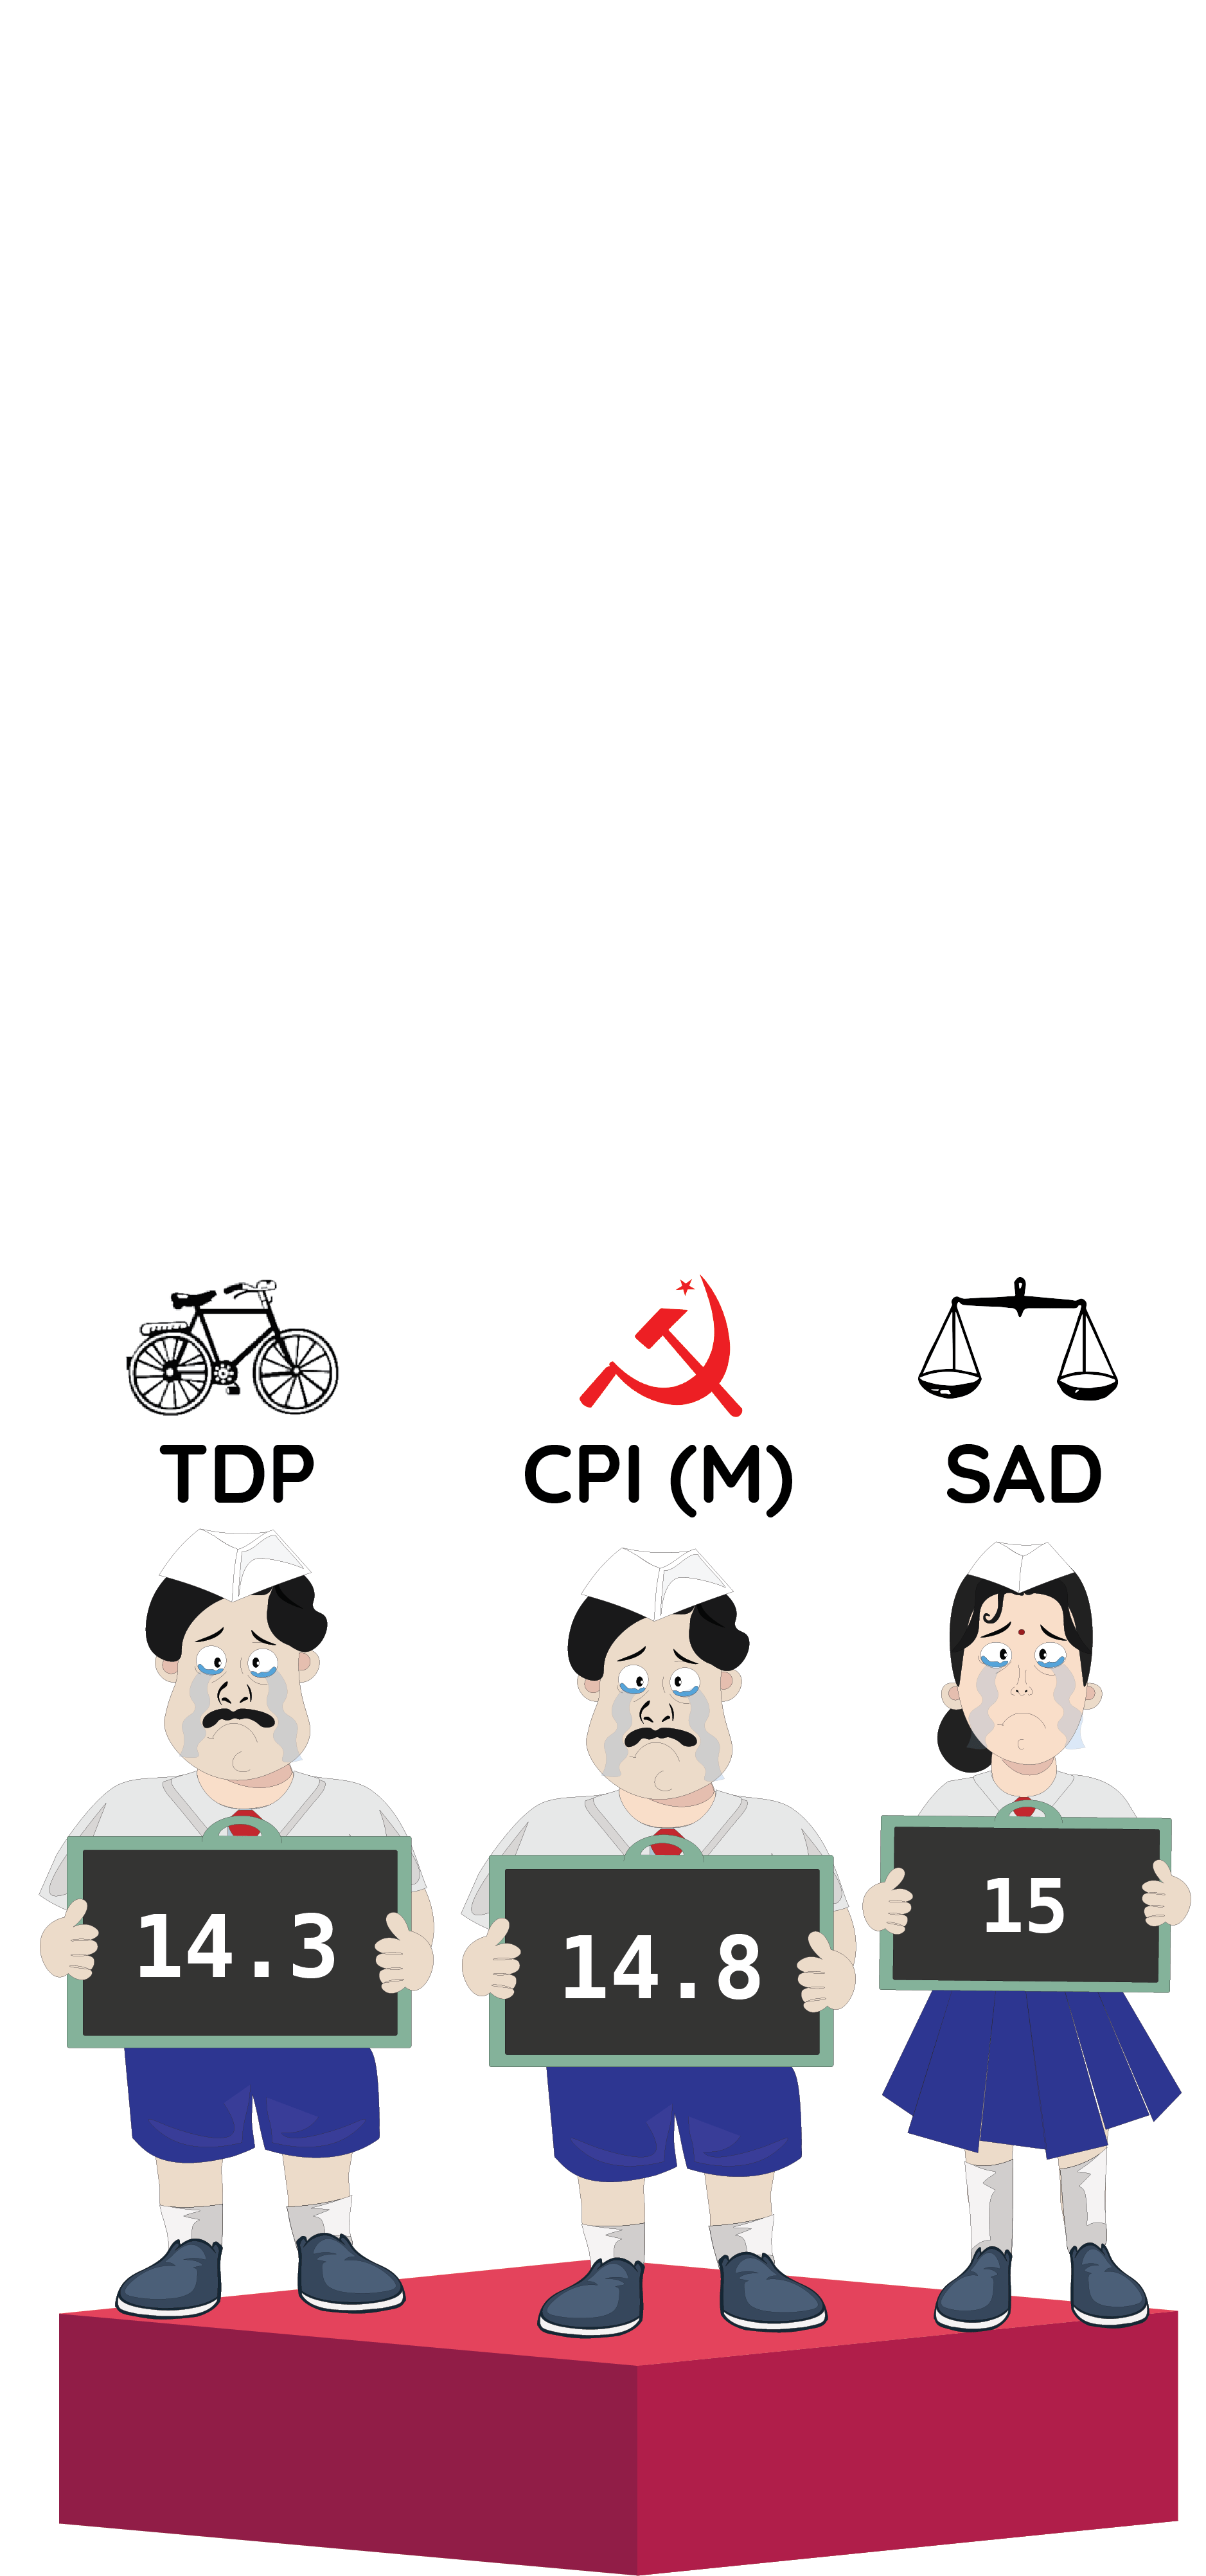
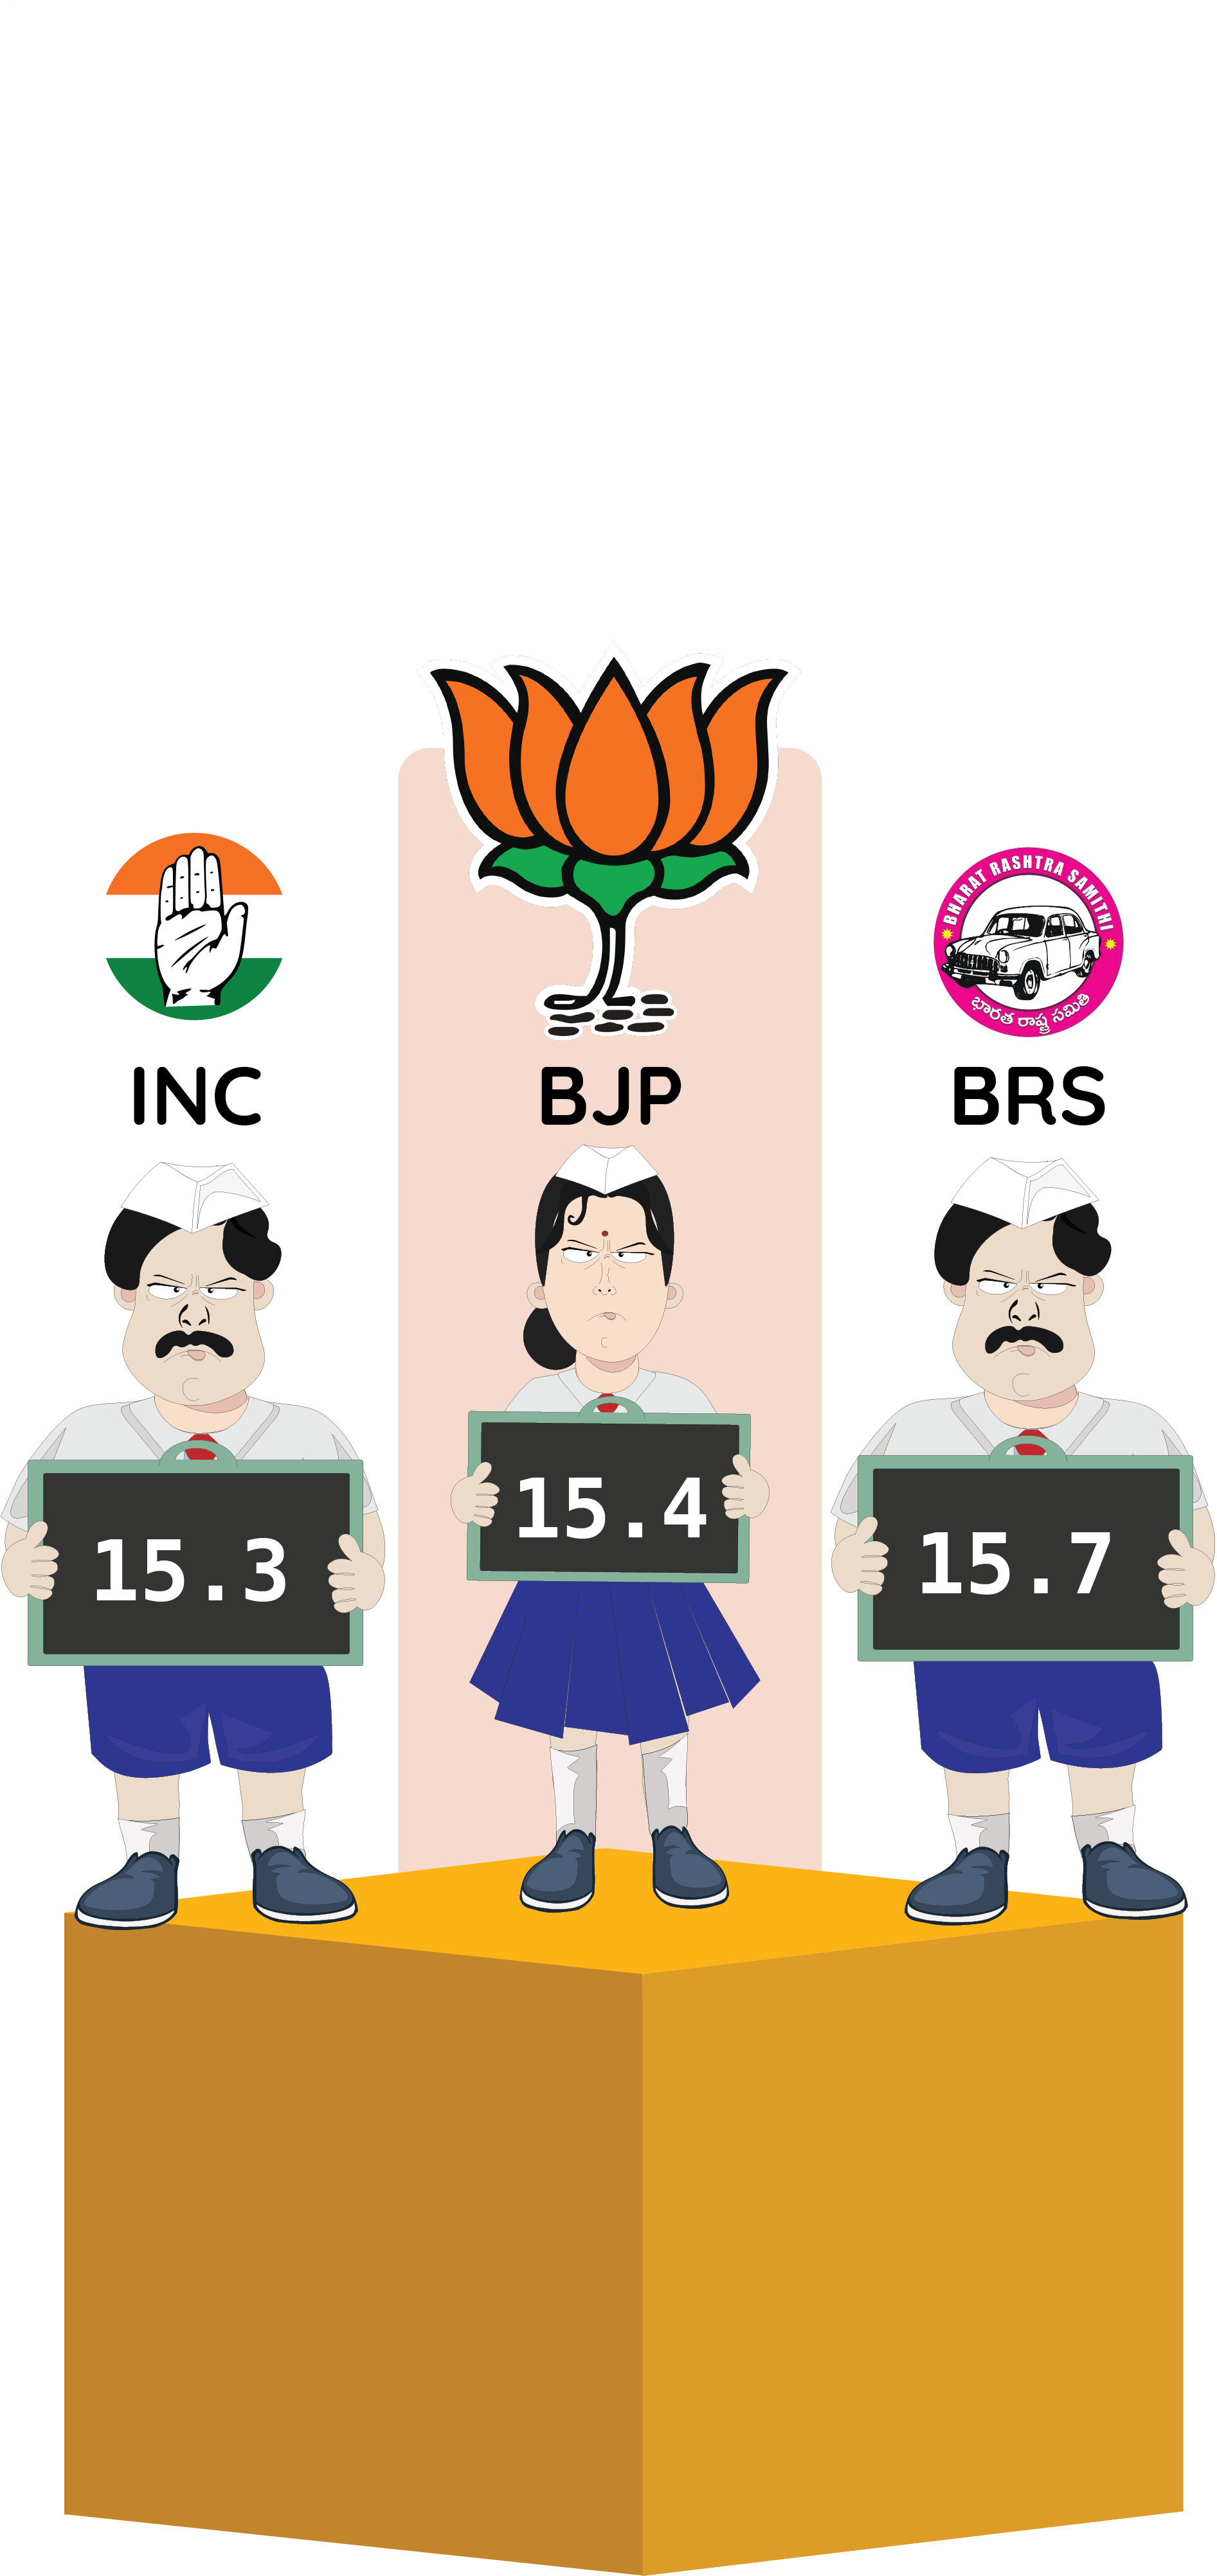
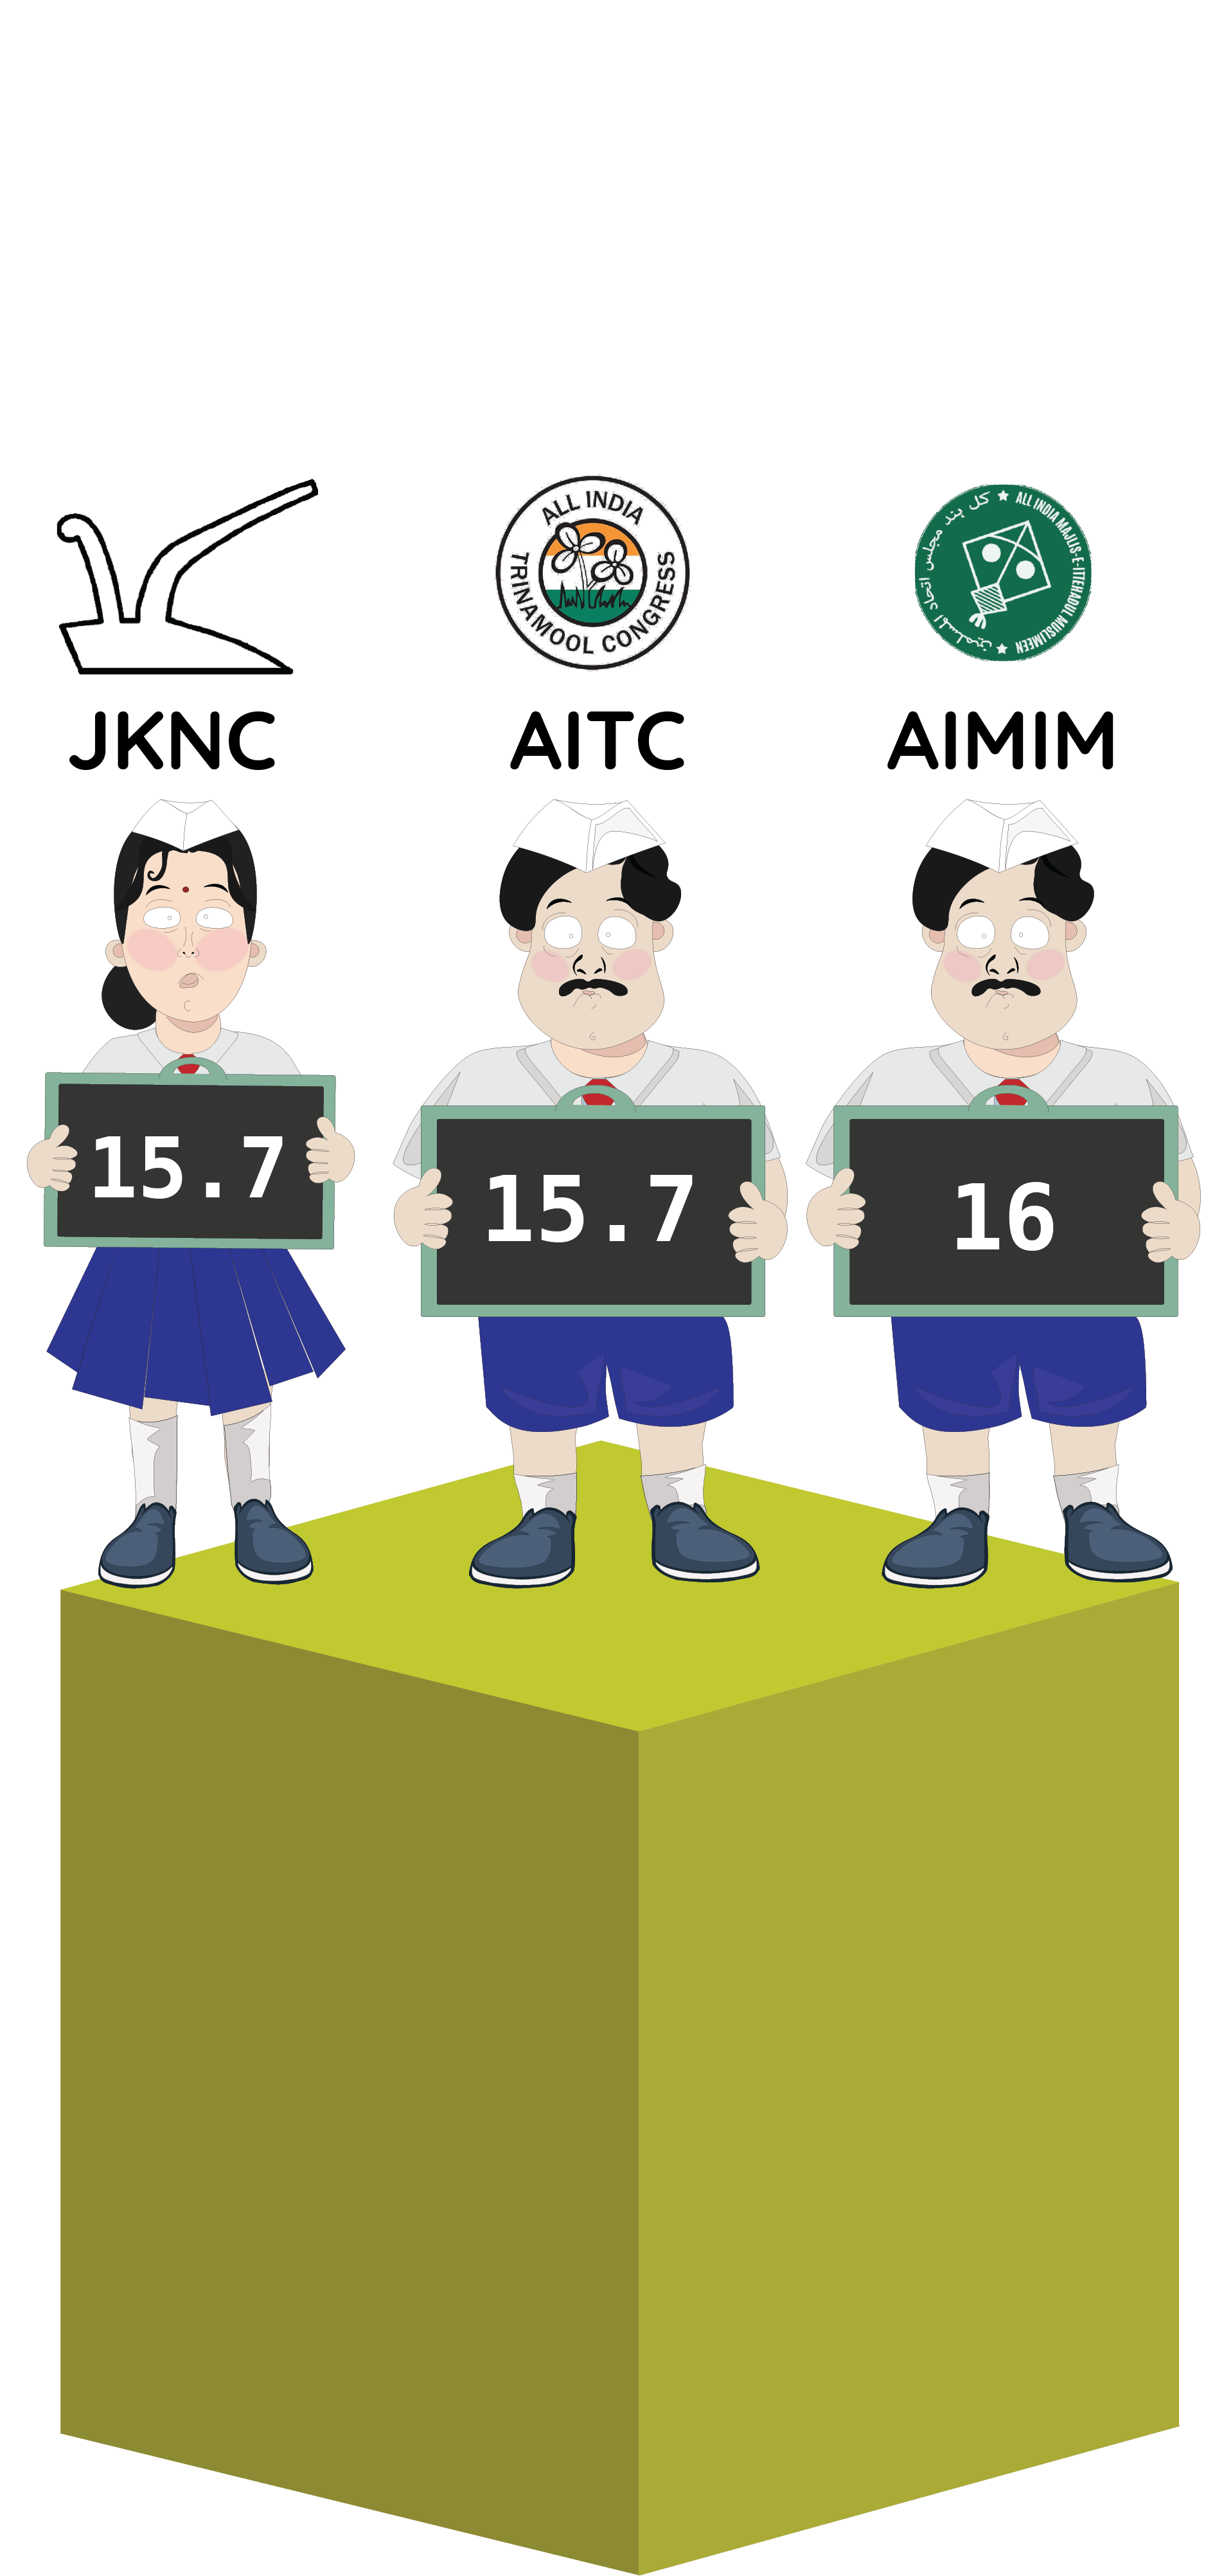
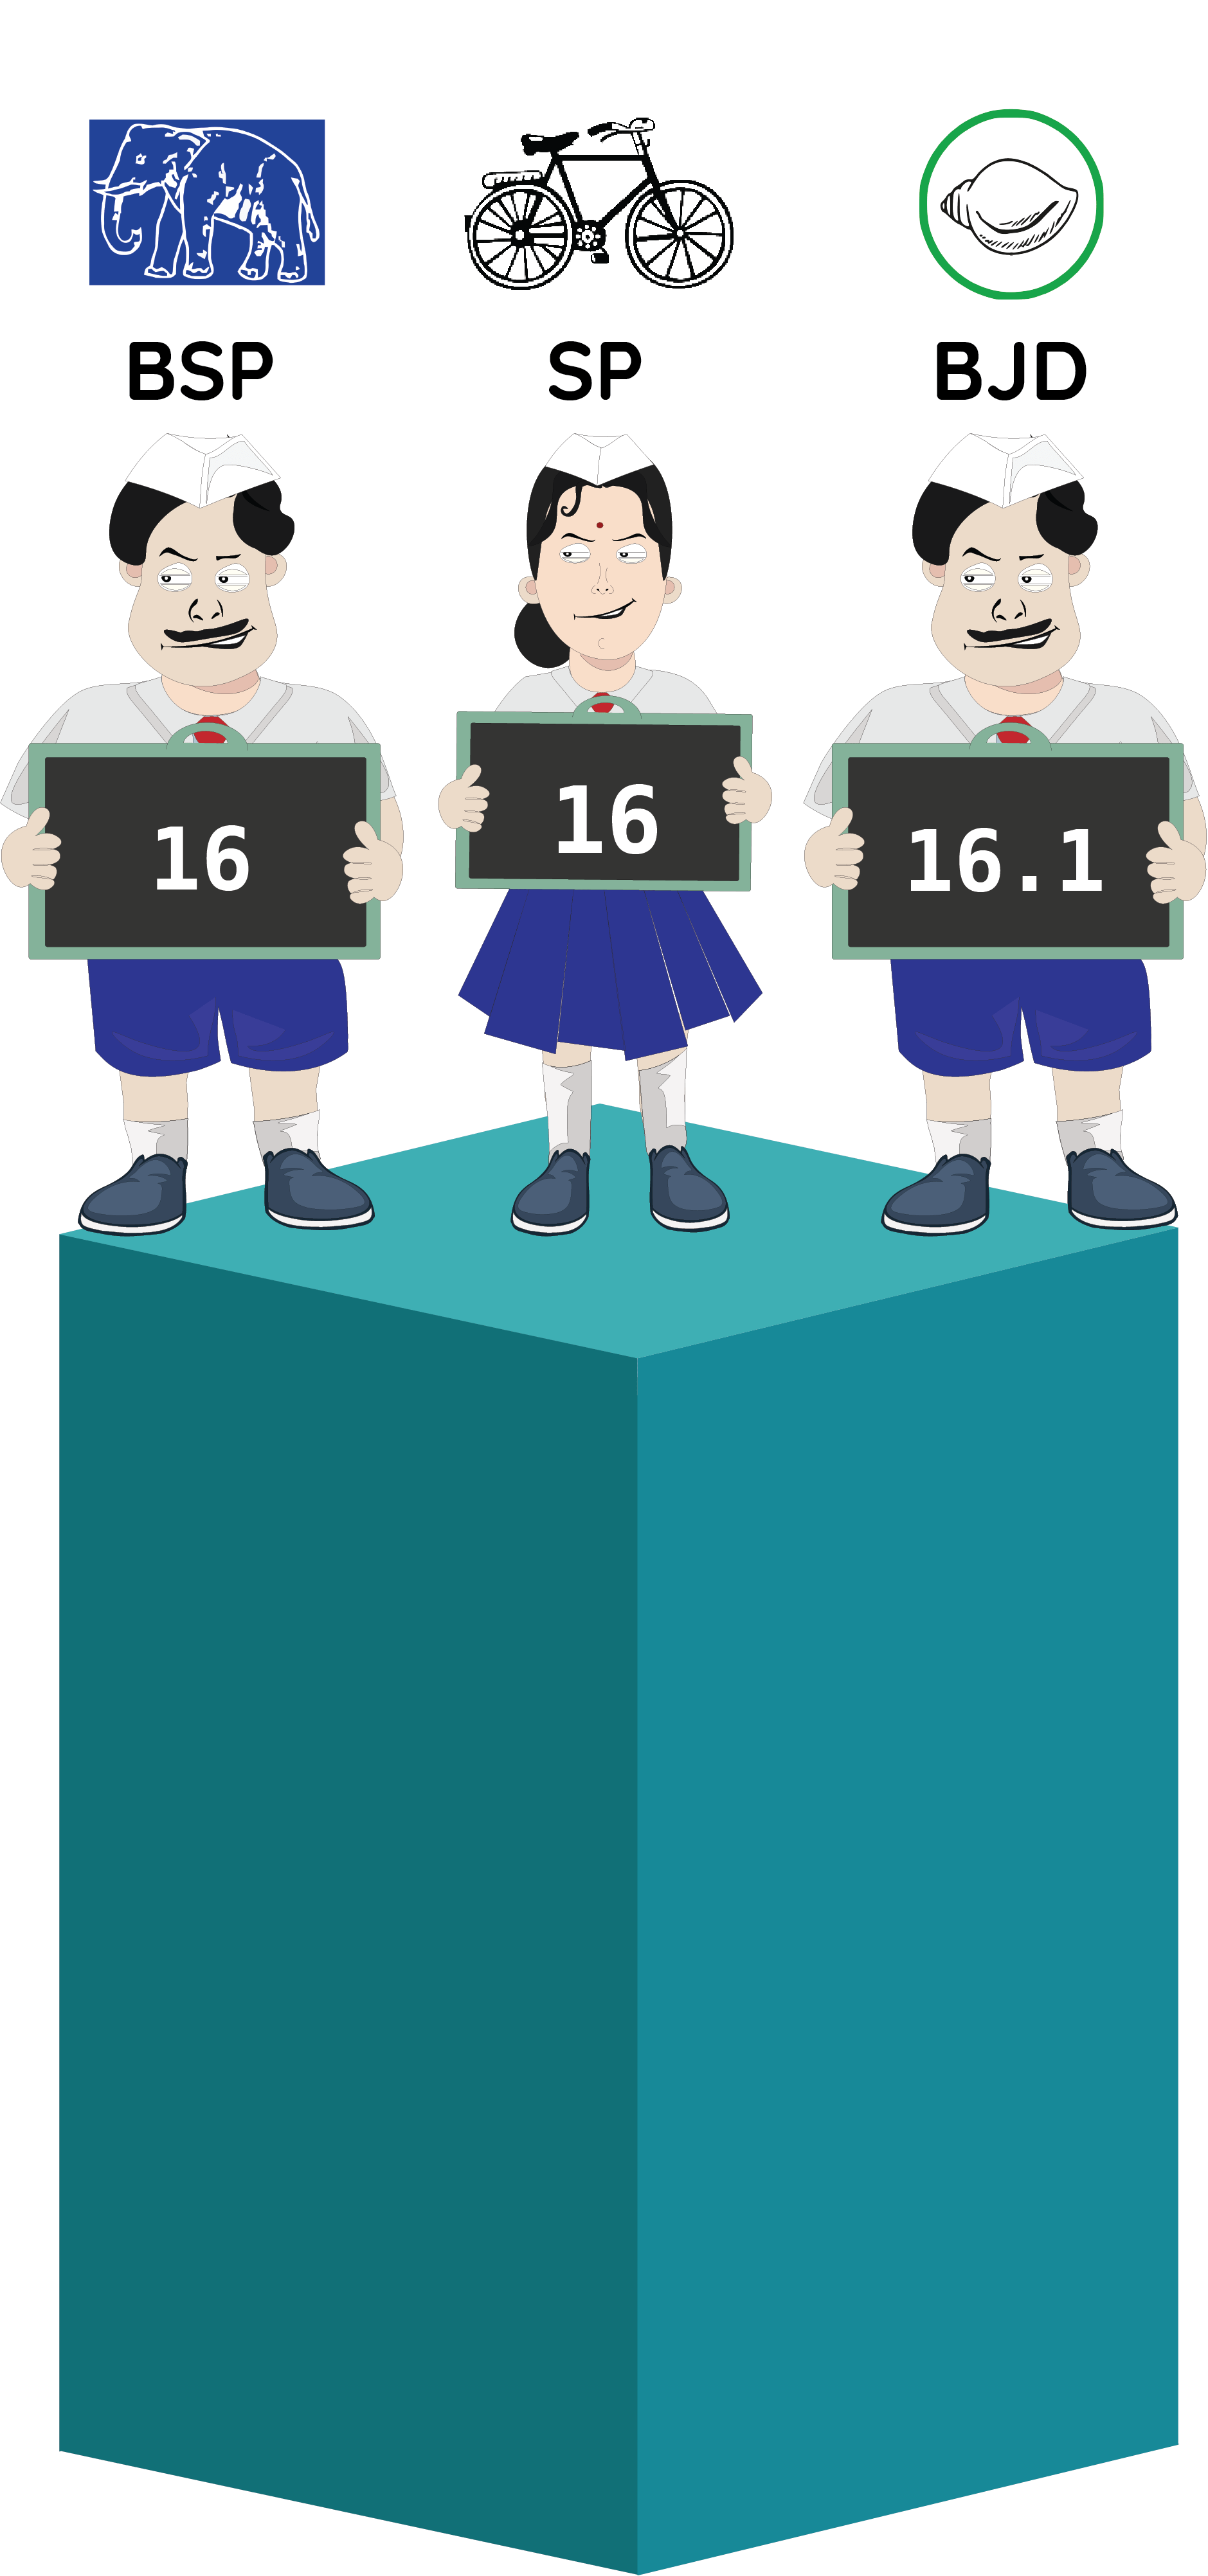
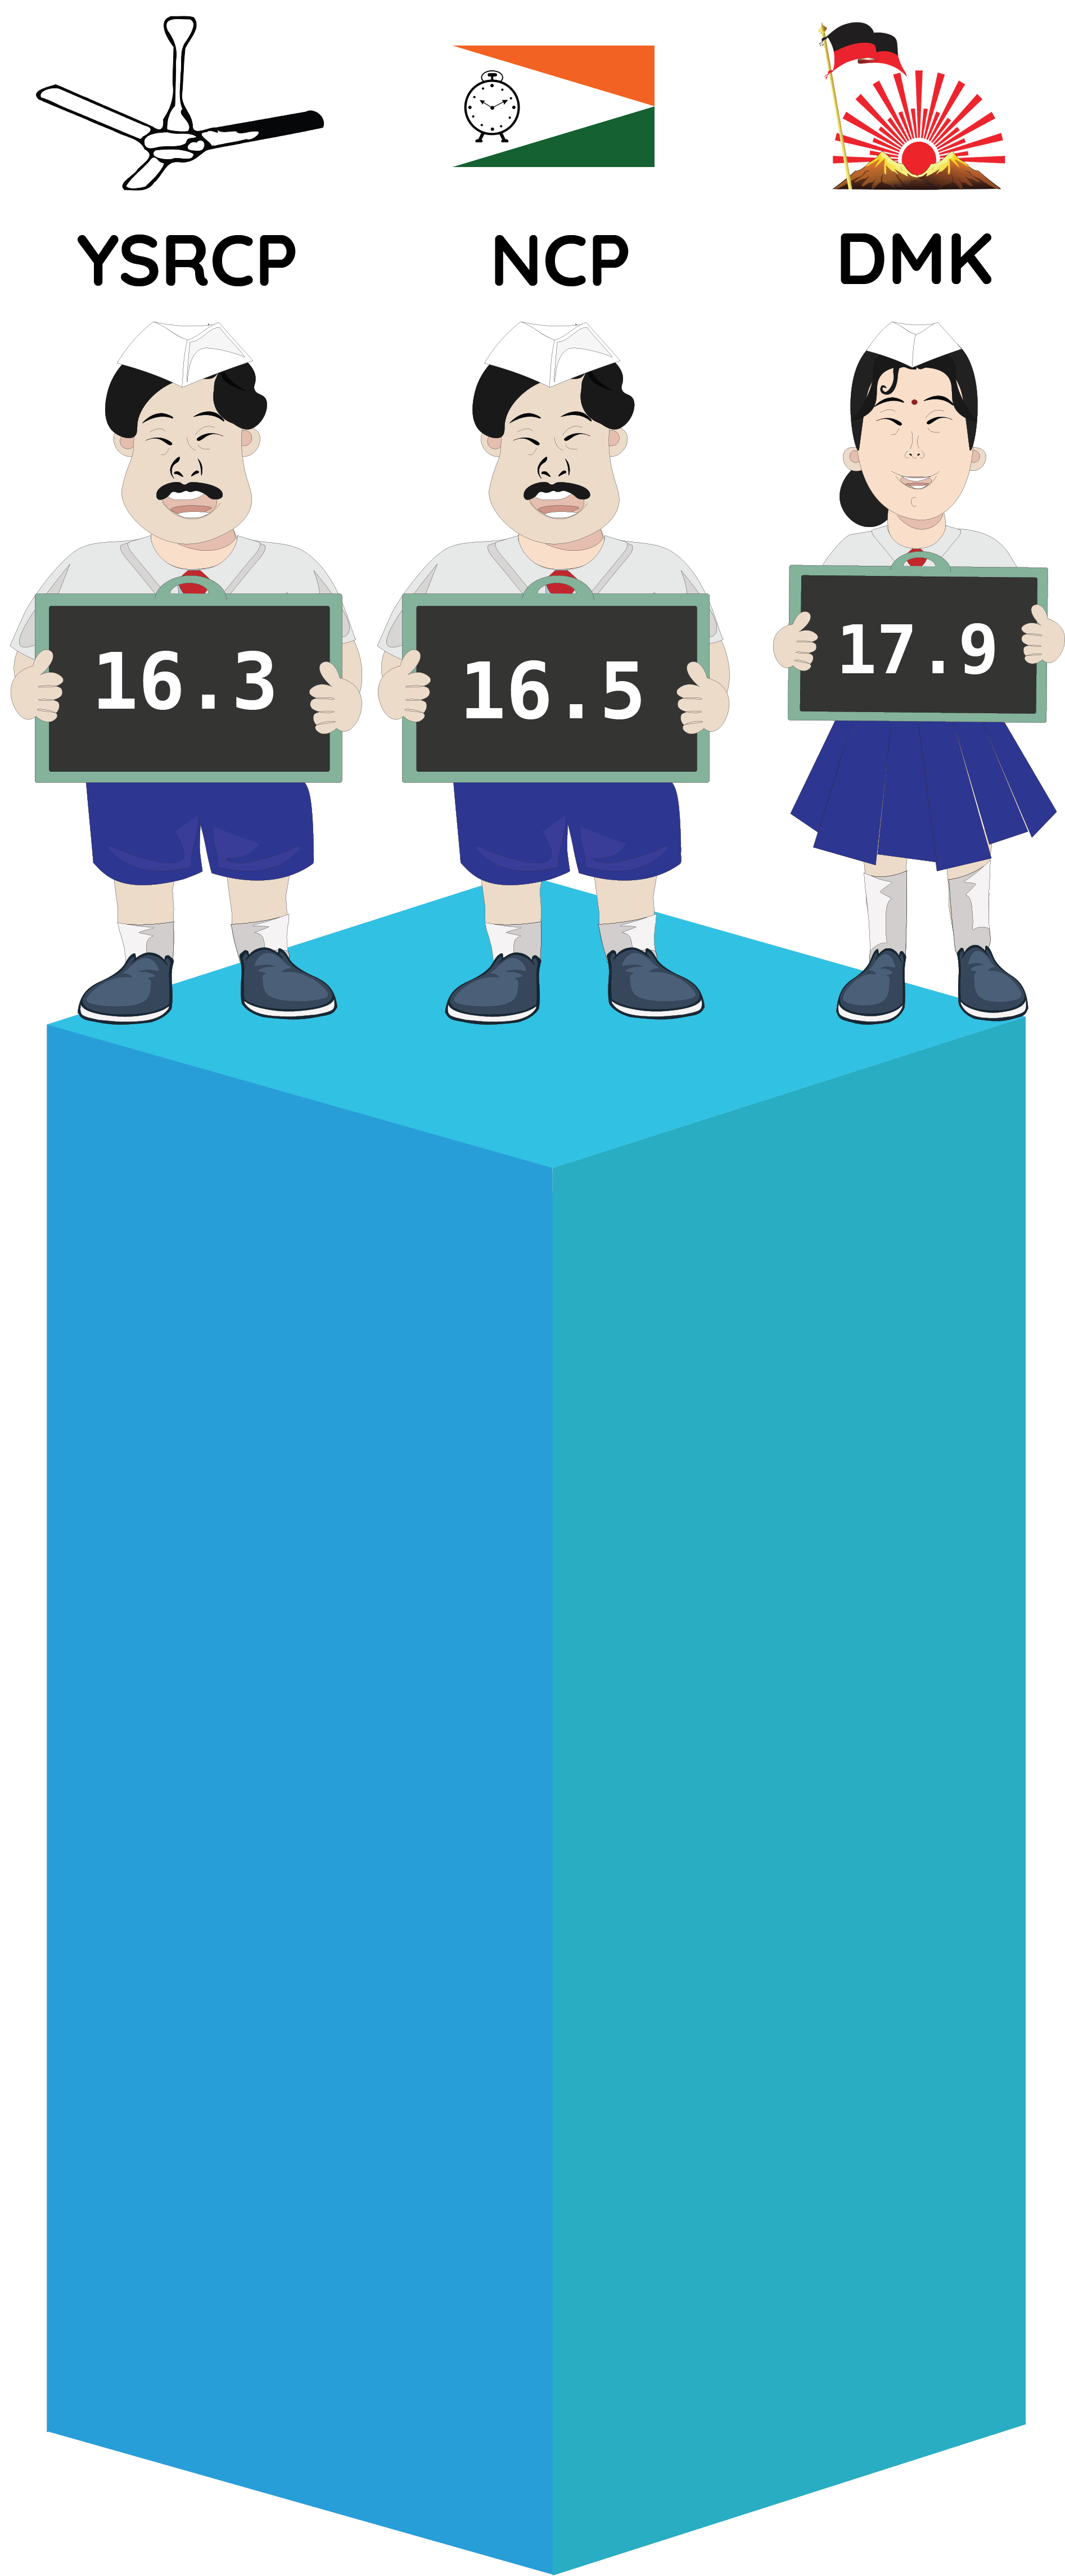
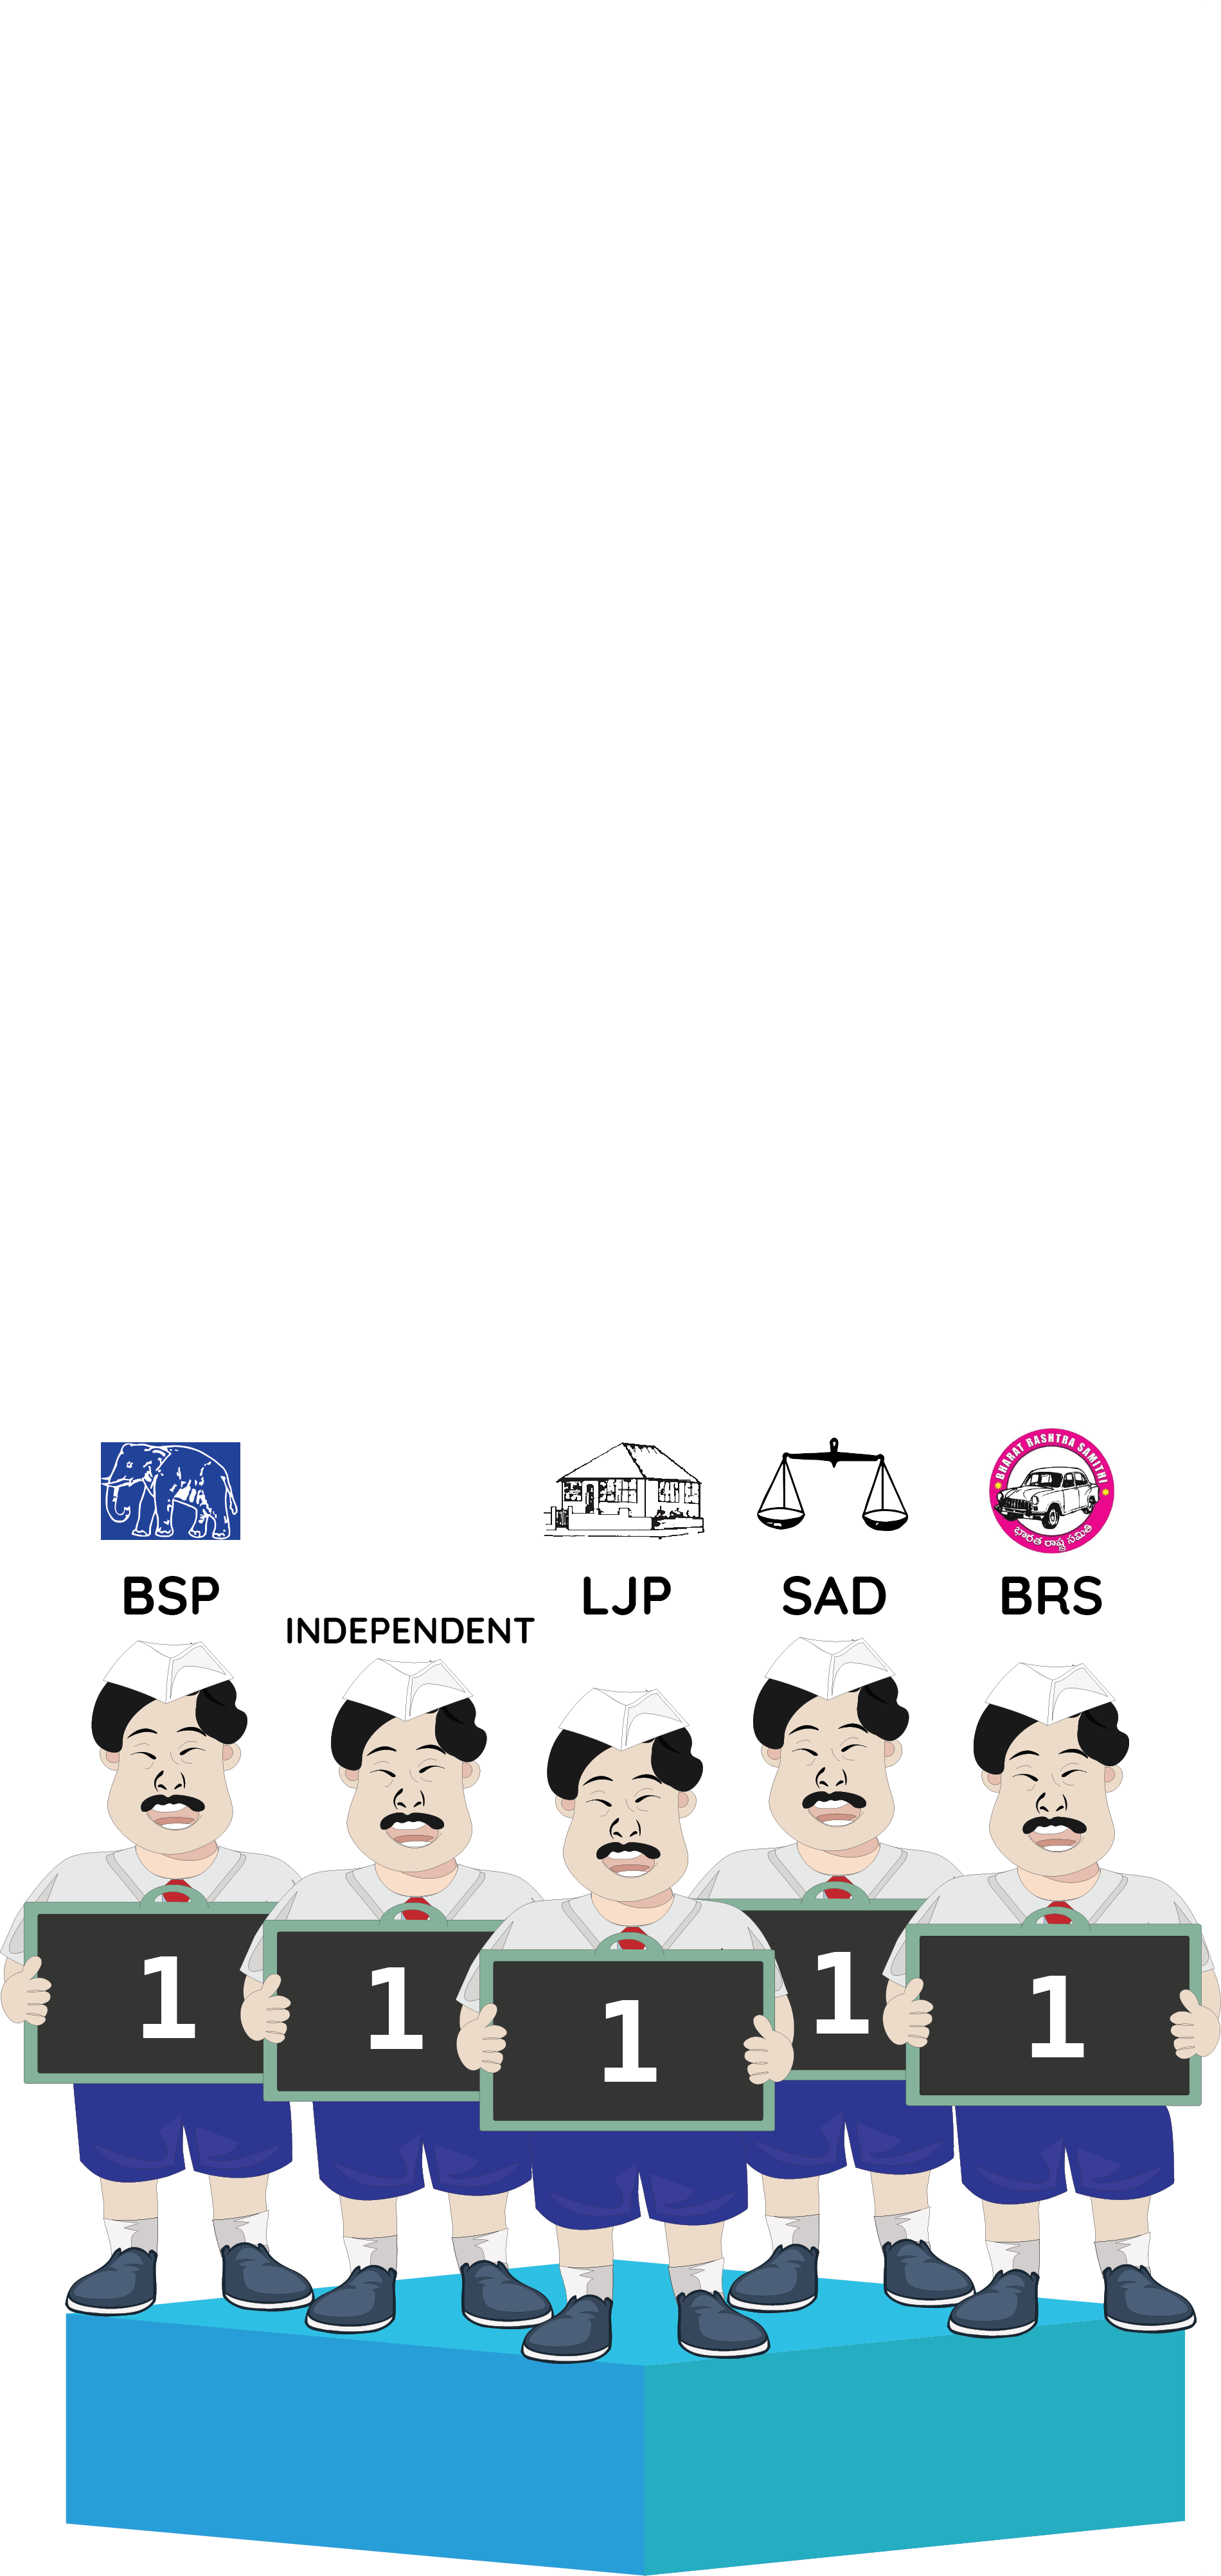
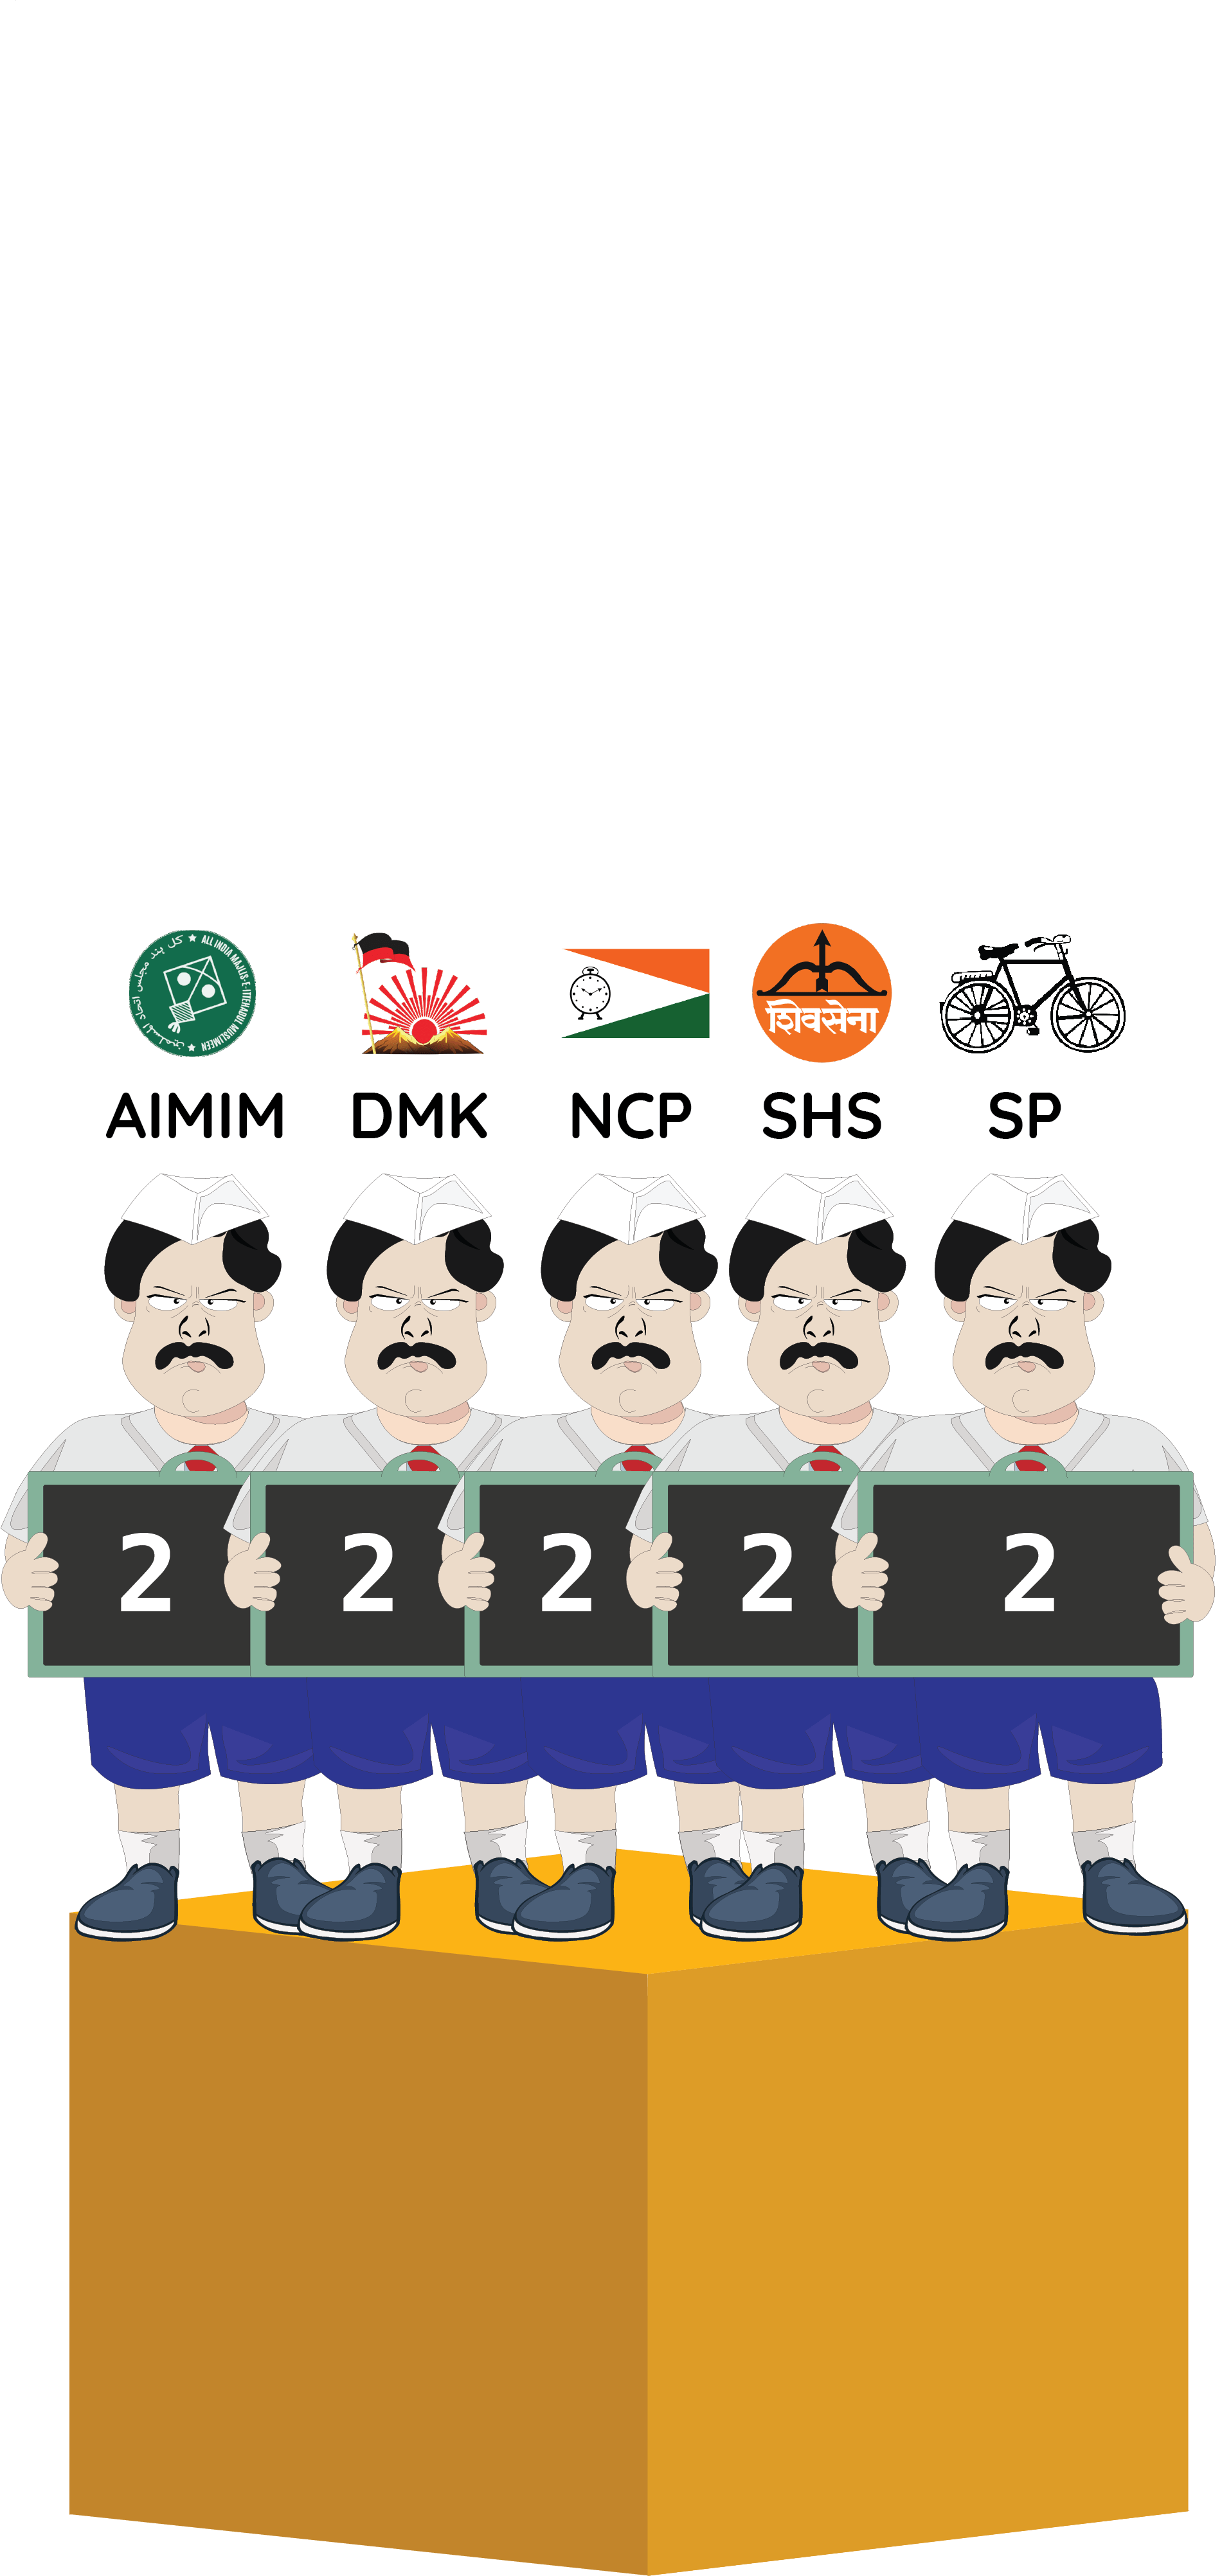
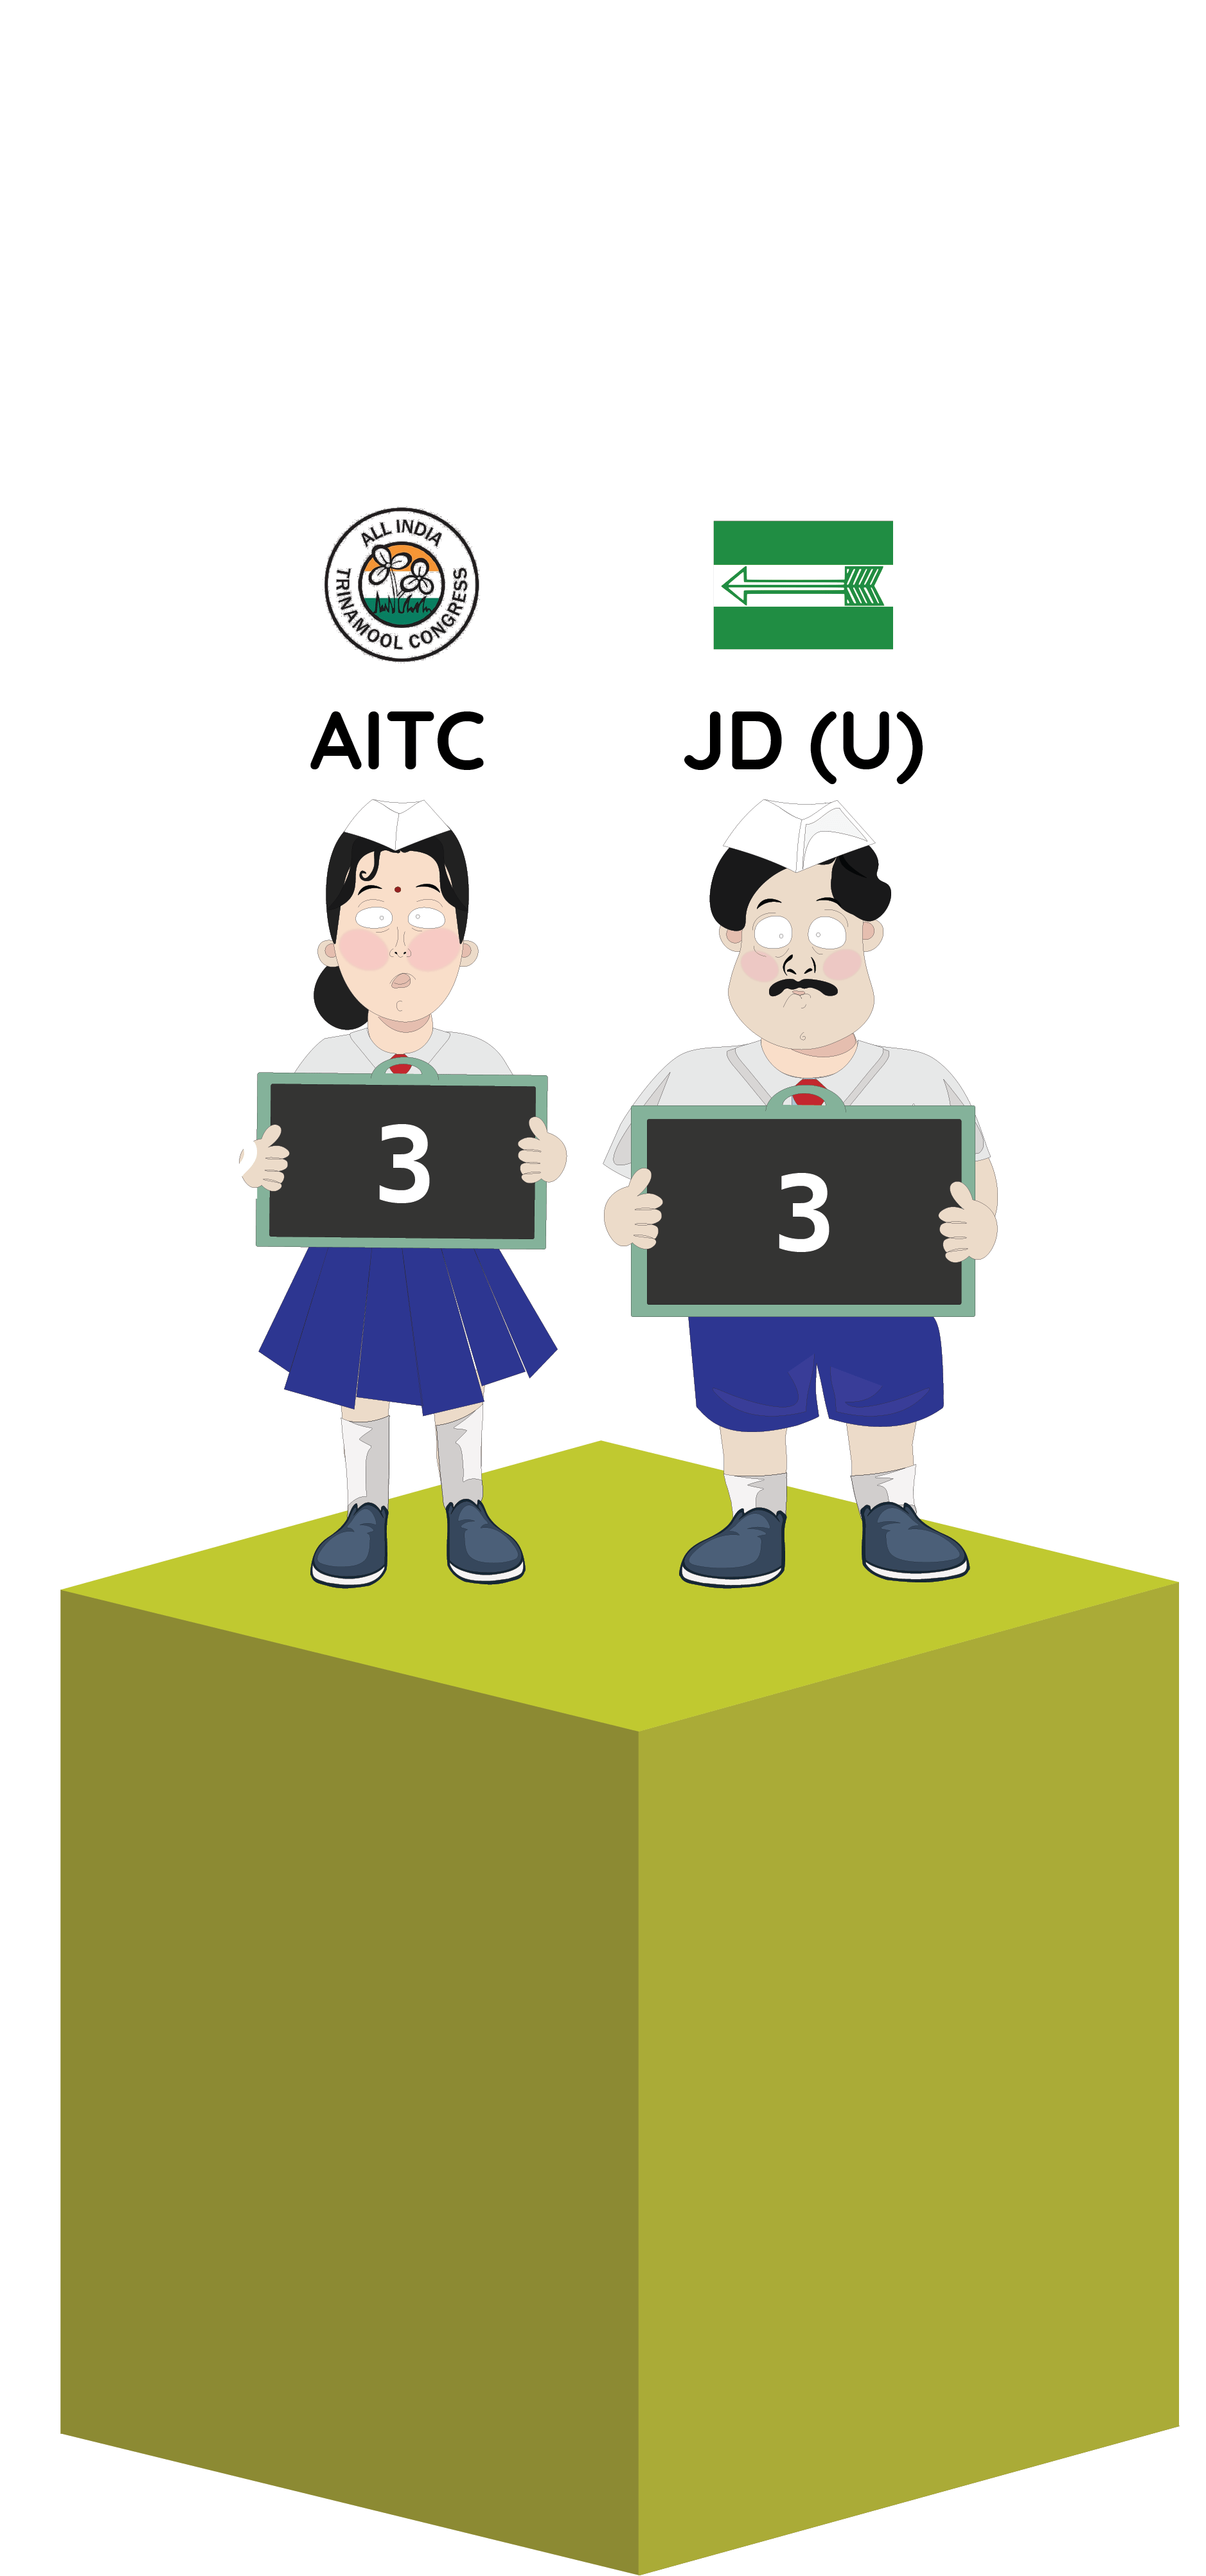
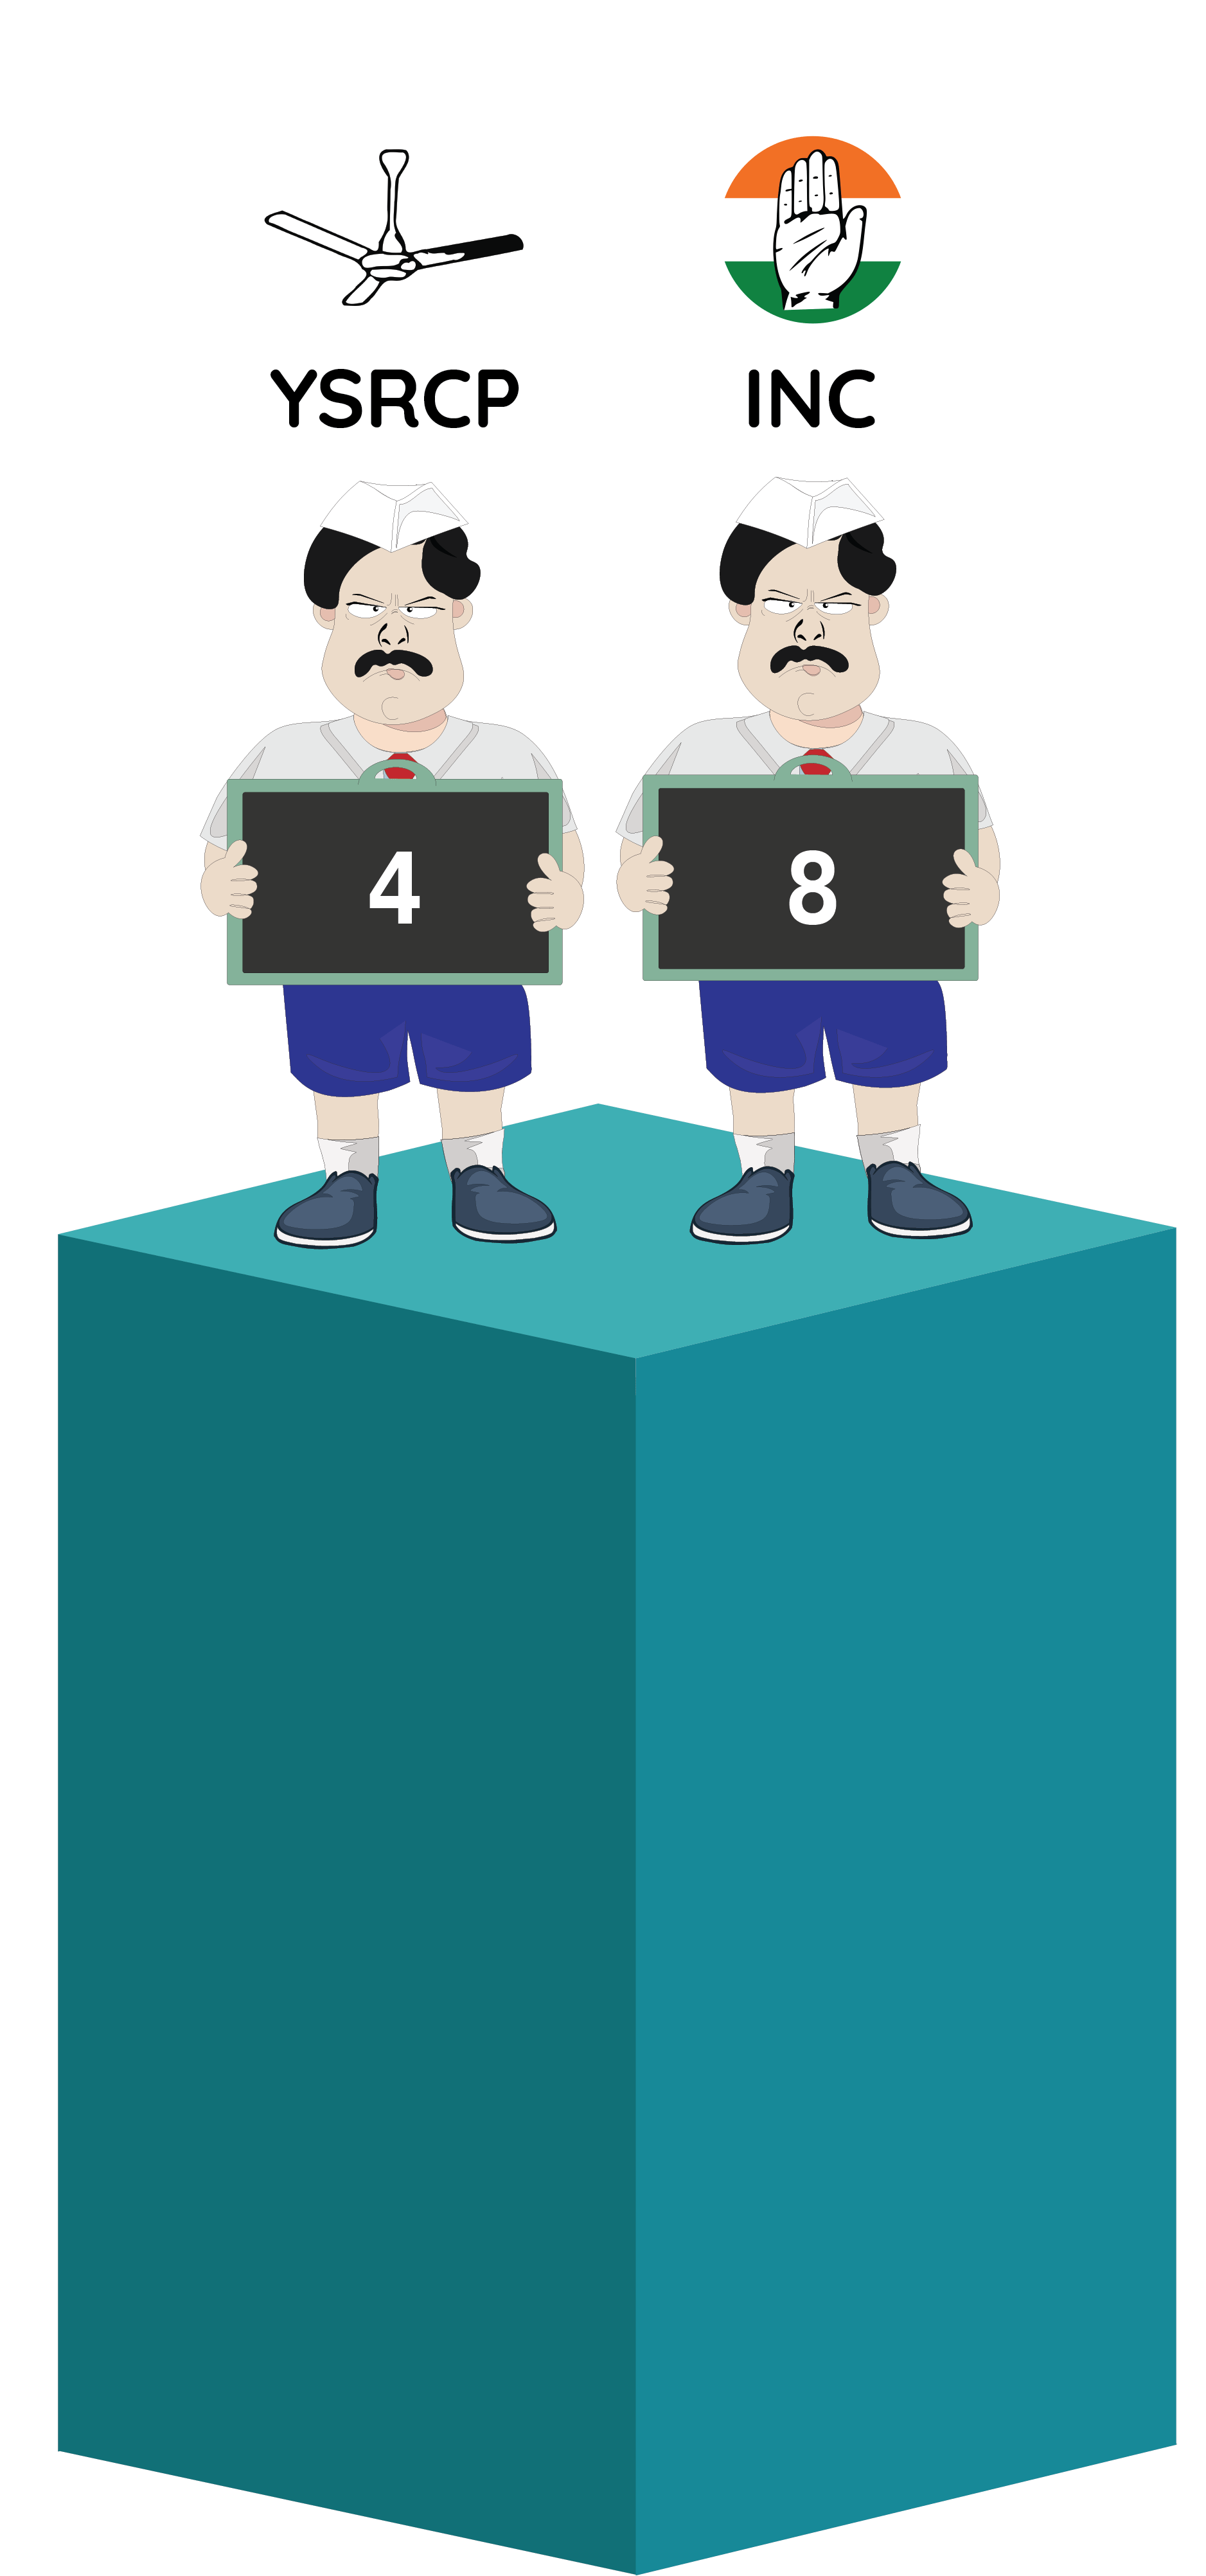
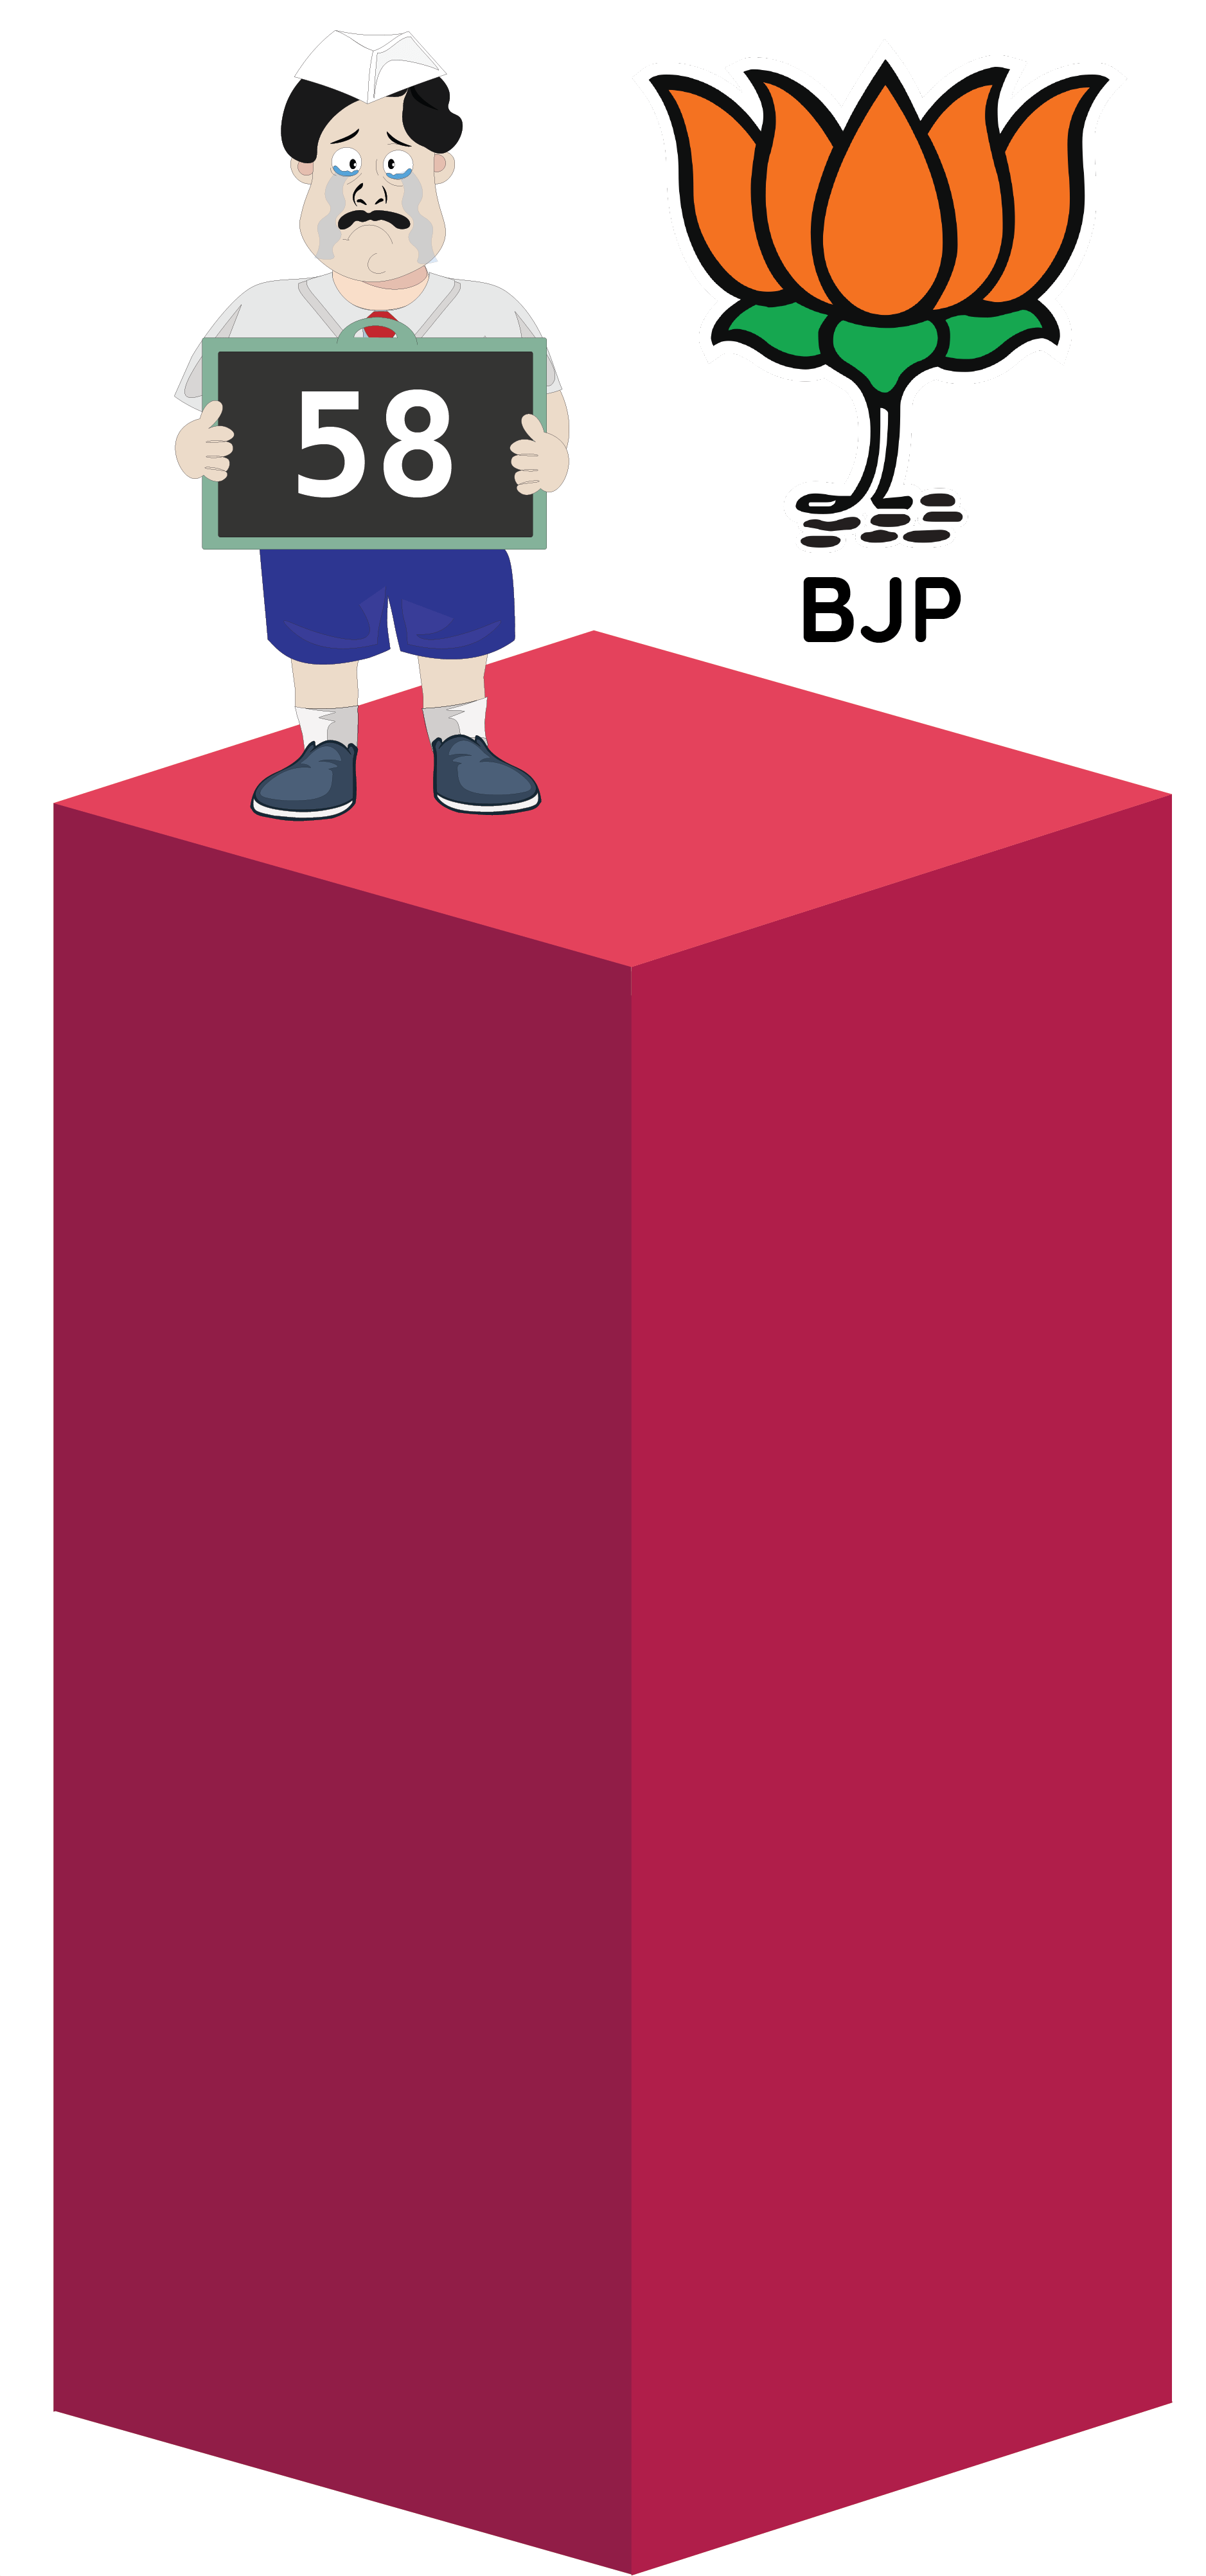
1. The information presented above pertains to the Top 15 performing Political parties in each category. A party being absent from any one graphic signifies that their performance for that category (eg. Average Number of Debates participated in) is either below or on-par with the lowest ranking party in the particular category.

2. The numbers shown in the ‘slates’ is the average value for a typical Member of Parliament (MP) in the Lok Sabha for that category. For example, BJP with '182' in the 'Average Number of Questions asked in the house' graphic indicates that the typical MP of the BJP asked 182 questions over 5 years vs. for instance, 450 questions asked by a typical MP from the NCP.

Reach Out

If you spot any discrepancies in our reported data, please don't hesitate to reach out via email so we can swiftly address the issue and ensure accuracy for all users.

Contact Us